Fig. 2.
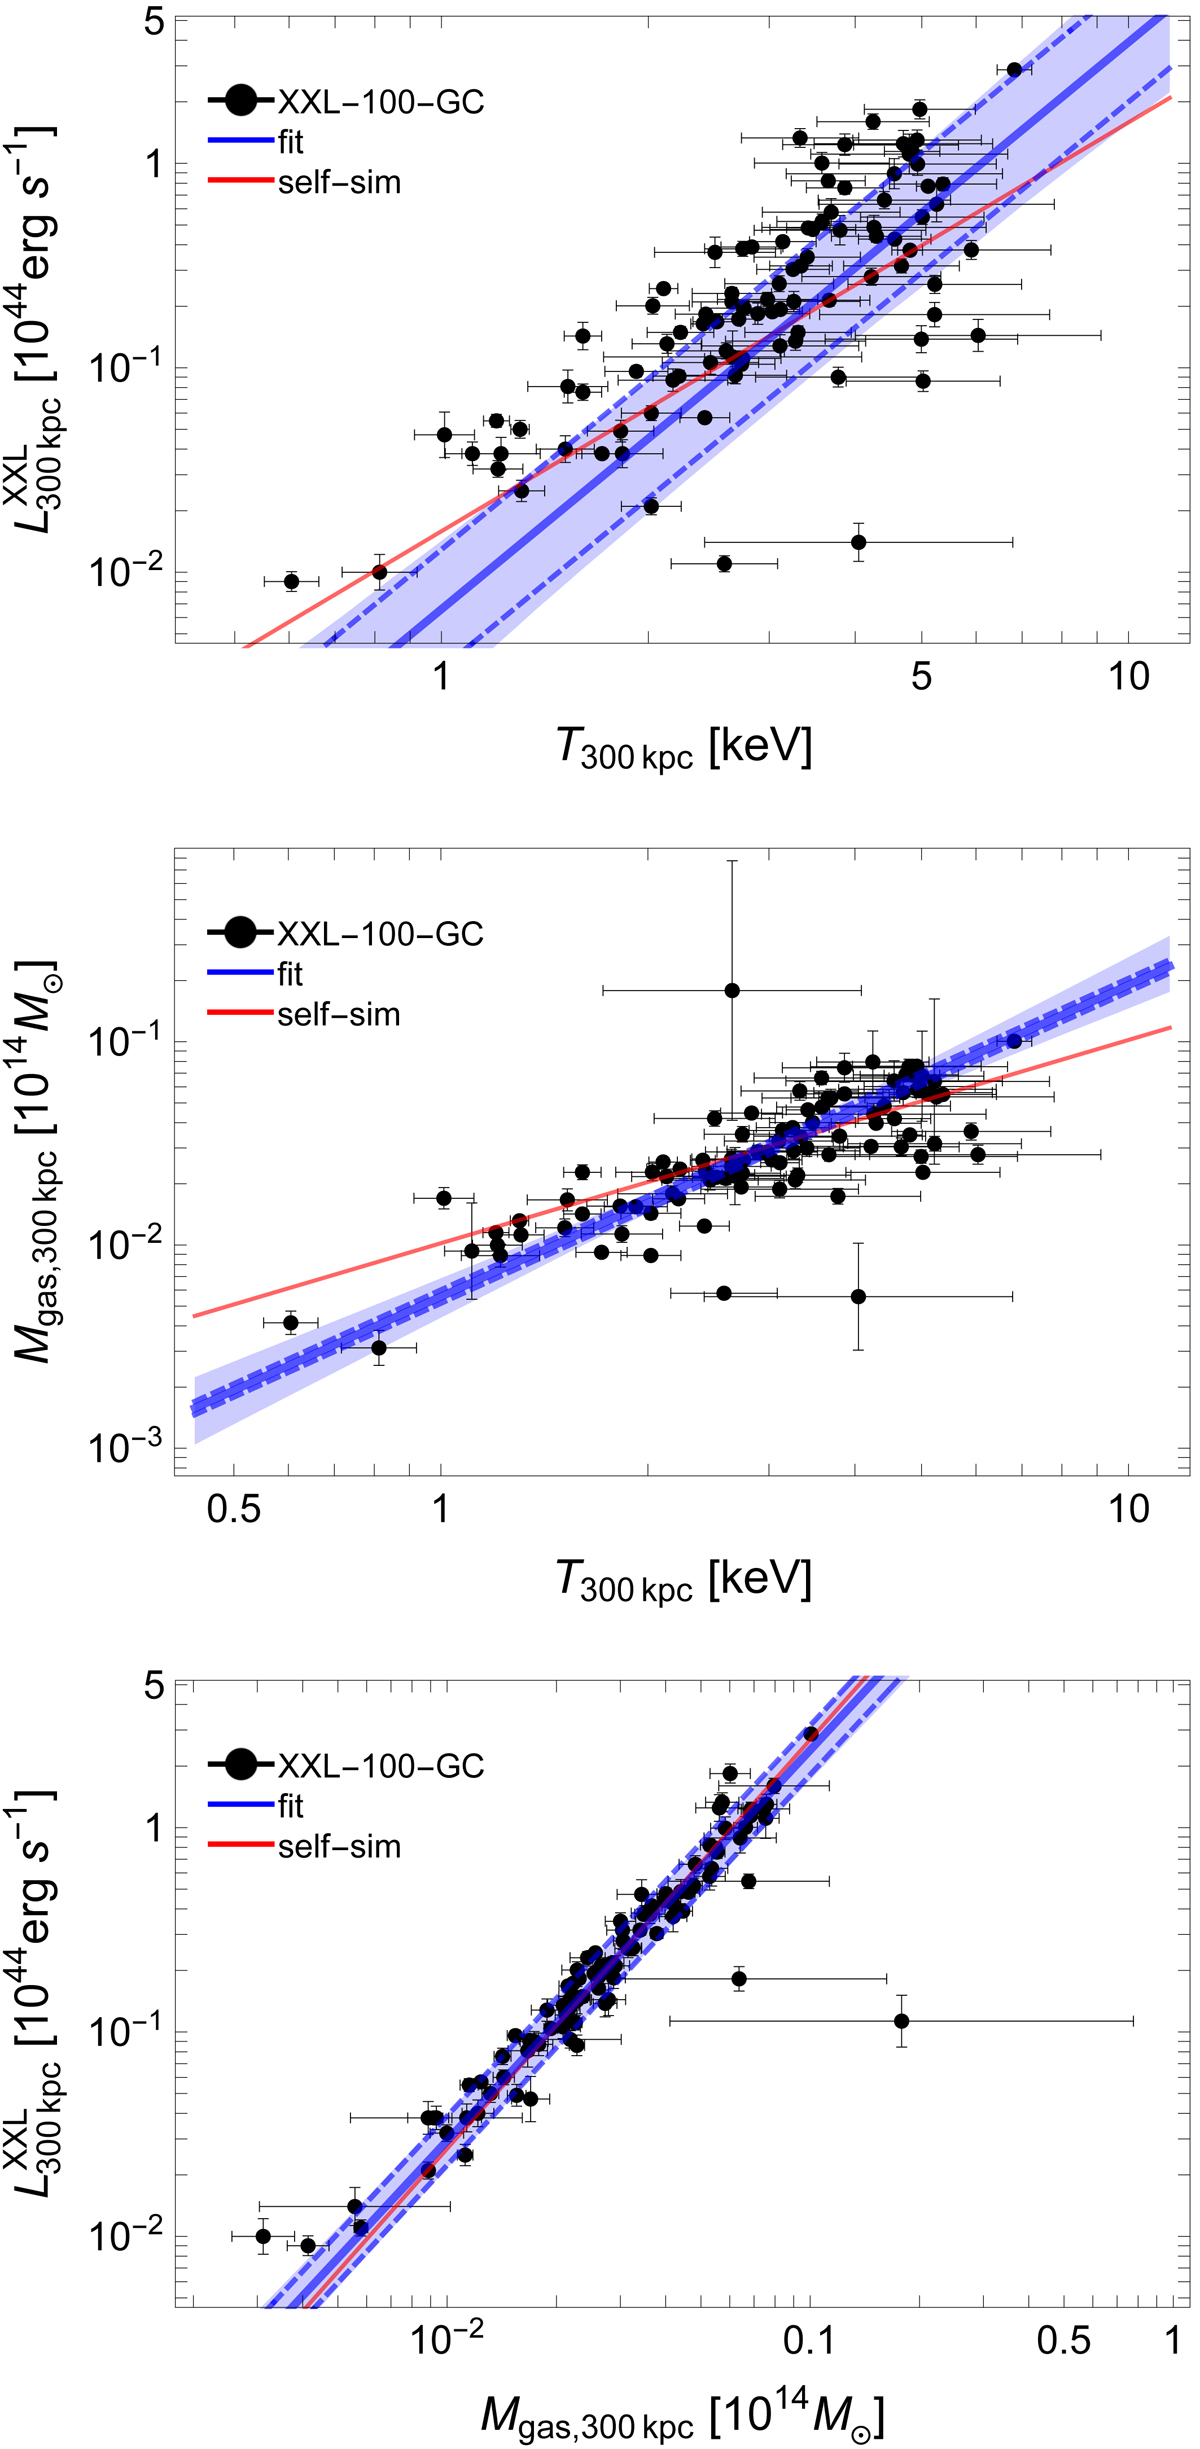
Scaling relations. The black points indicate the data, the blue lines represent the fitted scaling relation at the median redshift. The dashed blue lines show the median scaling relation (solid blue line) plus or minus the intrinsic scatter σY|Z. The shaded blue region encloses the 68.3% confidence region around the median due to uncertainties on the scaling parameters. The red line shows the self-similar prediction. Top panel: scaling between luminosity and temperature: l − t. Middle panel: scaling between gas mass and temperature: mg − t. Bottom panel: scaling between luminosity and gas mass: l − mg.
Current usage metrics show cumulative count of Article Views (full-text article views including HTML views, PDF and ePub downloads, according to the available data) and Abstracts Views on Vision4Press platform.
Data correspond to usage on the plateform after 2015. The current usage metrics is available 48-96 hours after online publication and is updated daily on week days.
Initial download of the metrics may take a while.