Open Access
Fig. 3
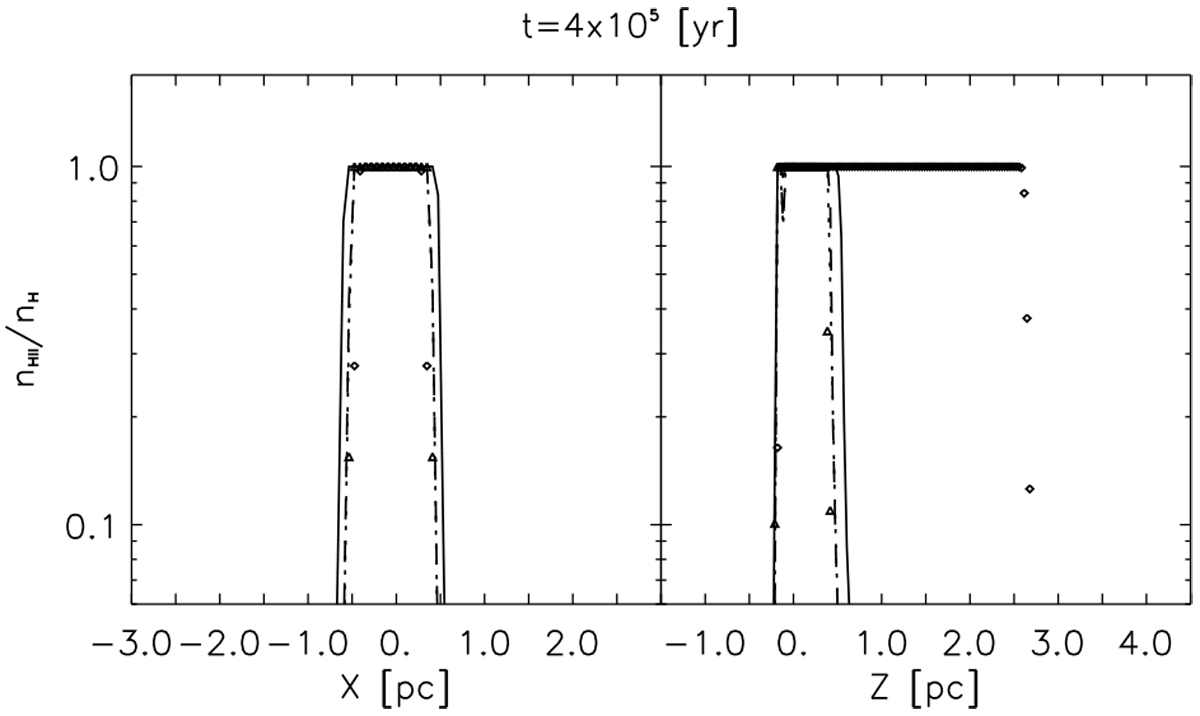
Ionisation fraction for the M1, M2, M3, and M4 models at 0.4 Myr for a cut on the X and Z axes (left and right panel, respectively) in the centre of the simulation box. Lines and symbols are as in Fig. 2.
Current usage metrics show cumulative count of Article Views (full-text article views including HTML views, PDF and ePub downloads, according to the available data) and Abstracts Views on Vision4Press platform.
Data correspond to usage on the plateform after 2015. The current usage metrics is available 48-96 hours after online publication and is updated daily on week days.
Initial download of the metrics may take a while.