Fig. 2
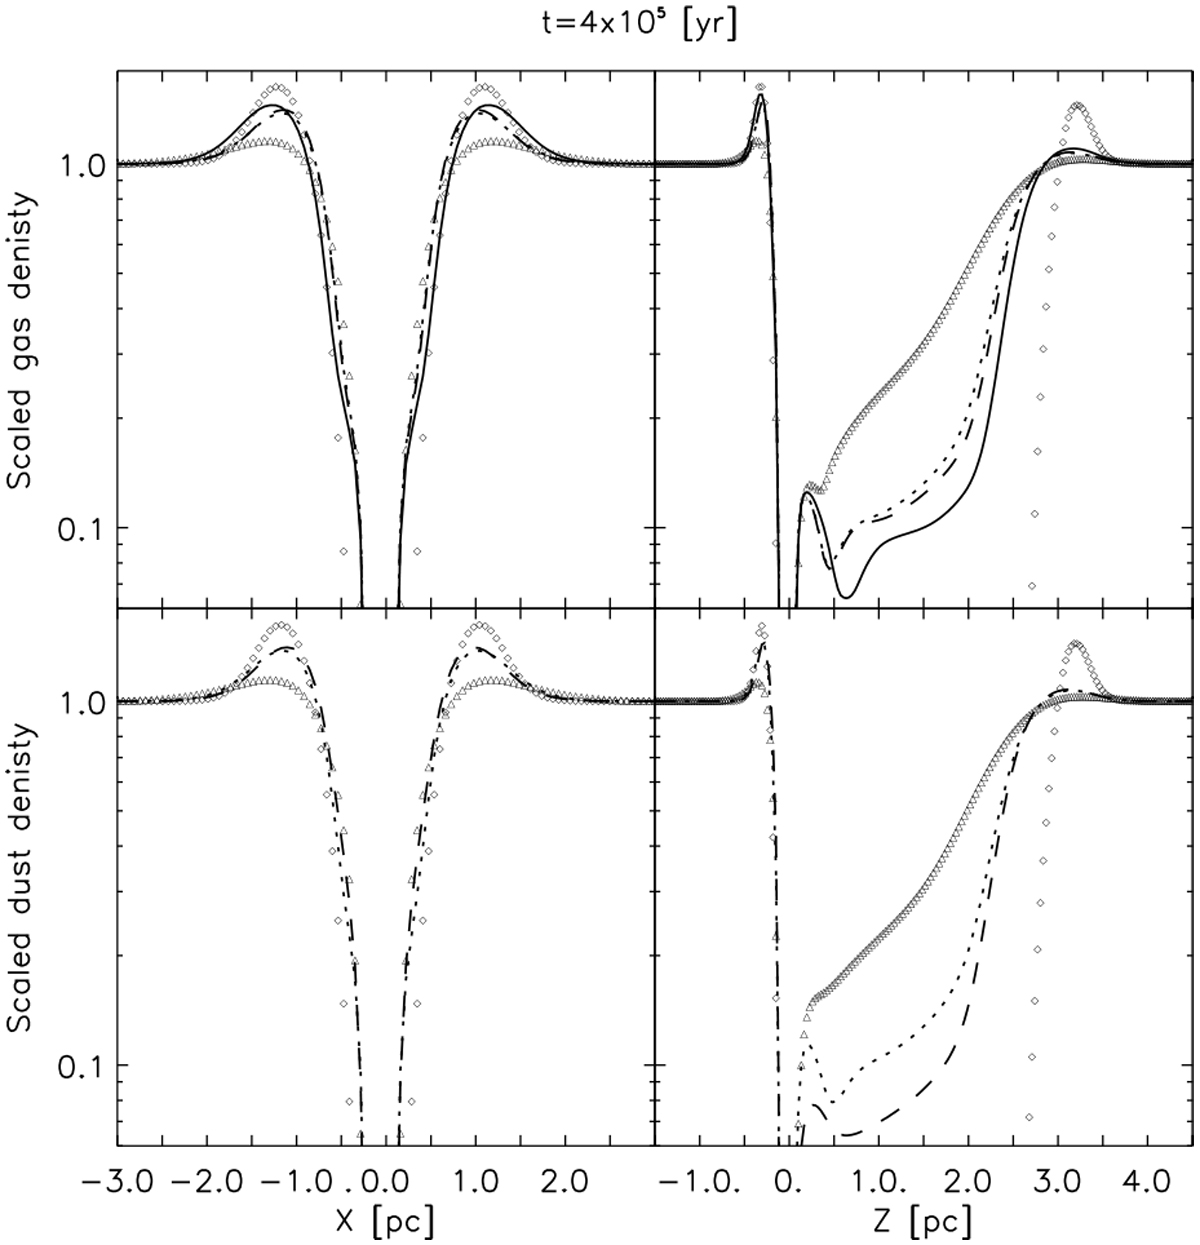
Scaled gas density (upper panels) and scaled dust density (lower panels) along the X-axis (perpendicular to the direction of star propagation) and Z-axis (along the moving direction), at 0.4 Myr. The diamonds correspond to the M1 model, the solid, dotted, and dashed lines correspond to models M2, M3, and M4, and the triangles are for the M5 model, respectively.
Current usage metrics show cumulative count of Article Views (full-text article views including HTML views, PDF and ePub downloads, according to the available data) and Abstracts Views on Vision4Press platform.
Data correspond to usage on the plateform after 2015. The current usage metrics is available 48-96 hours after online publication and is updated daily on week days.
Initial download of the metrics may take a while.