Fig. 6.
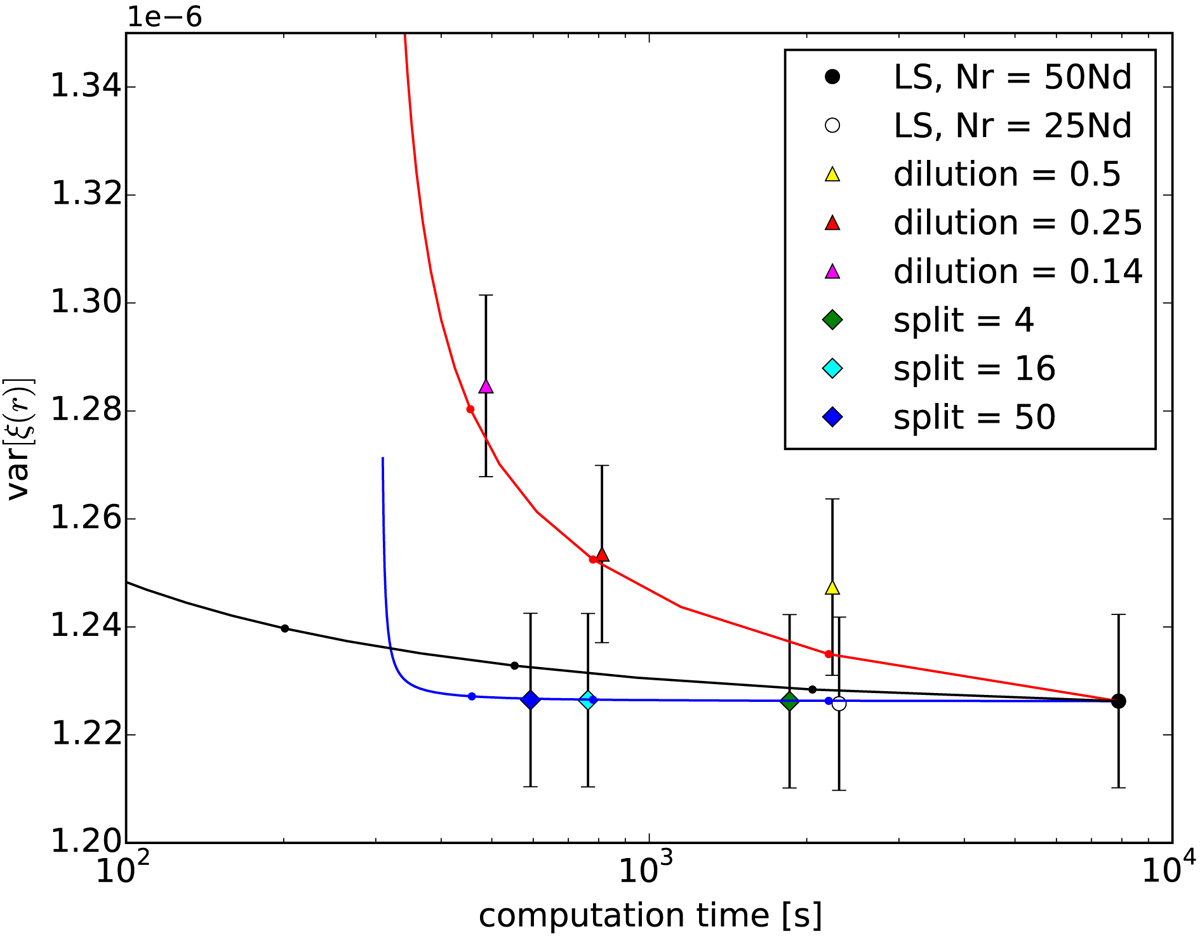
Measured variance (mean variance over the range r = 80 − 120 h−1 Mpc) vs. computational cost (mean computation time) for the different methods (markers with error bars) and our theoretical prediction (solid lines). The solid lines (blue for the split method, red for dilution, and black for standard LS with Mr ≤ 50) are our theoretical predictions for the increase in variance and computation time ratio when compared to the standard LS, Mr = 50, case, and the dots on the curves correspond to the measured cases (except for LS they are, from right to left, Mr = 25, 12.5, and (50/7); only the first of which was measured). The curve for split ends at Ms = 2500; the optimal case, Ms = Mr, is the circled dot. The error bars for the variance measurement are naive estimates that do not account for error correlations between bins. The theoretical predictions overestimate the cost savings (data points are to the right of the dots on curves; except for the smaller split factors, where the additional speed-up compared to theory is related to some other performance differences between our split and standard LS implementations). This plot would have a different appearance for other r ranges.
Current usage metrics show cumulative count of Article Views (full-text article views including HTML views, PDF and ePub downloads, according to the available data) and Abstracts Views on Vision4Press platform.
Data correspond to usage on the plateform after 2015. The current usage metrics is available 48-96 hours after online publication and is updated daily on week days.
Initial download of the metrics may take a while.