Fig. 5.
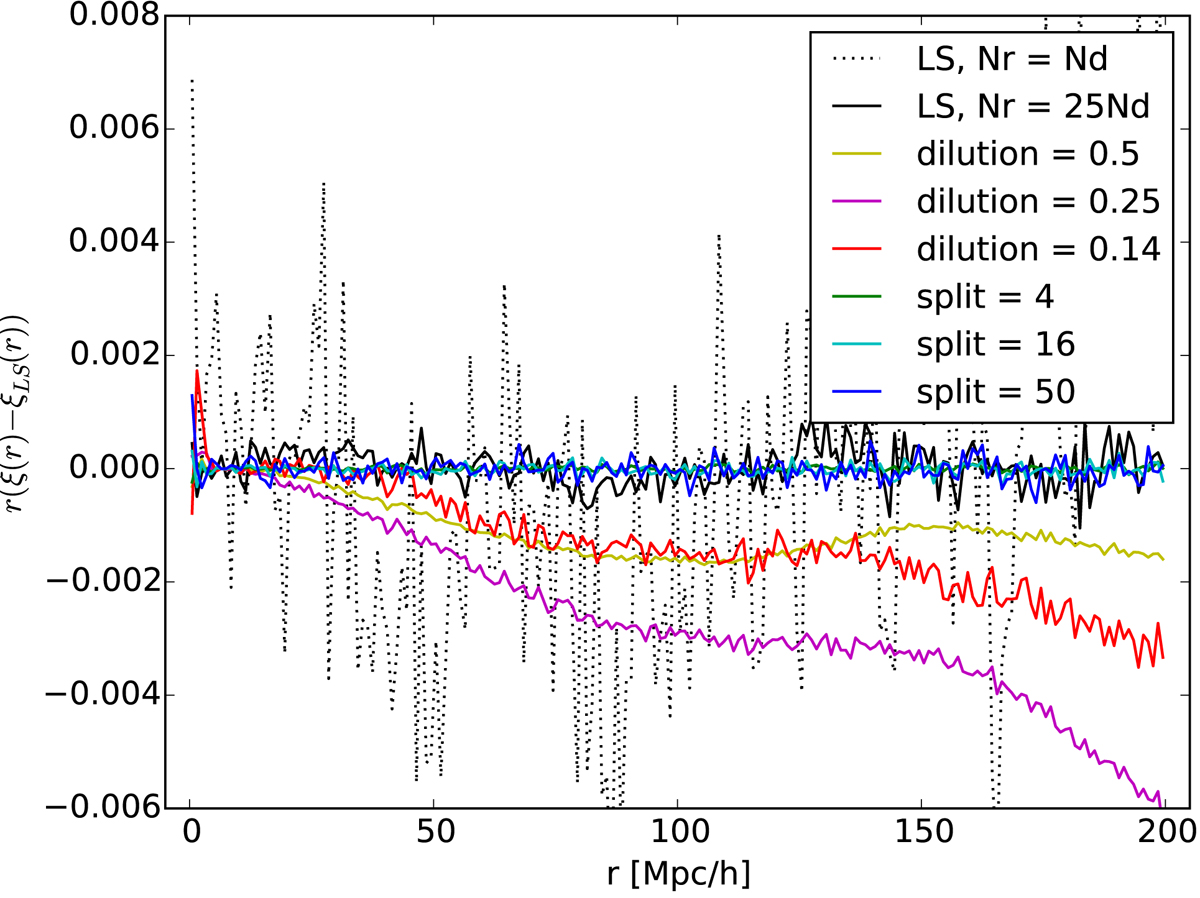
Differences between the mean ξ(r) estimate and that from the LS, multiplied by r to better display all scales. This measured difference is not the true bias, which is too small to measure with 300 mocks, and is mainly due to random error of the mean. The results for dilution appear to reveal a systematic bias, but this is just due to strong error correlations between nearby bins; for different subsets of the 300 mocks the mean difference is completely different.
Current usage metrics show cumulative count of Article Views (full-text article views including HTML views, PDF and ePub downloads, according to the available data) and Abstracts Views on Vision4Press platform.
Data correspond to usage on the plateform after 2015. The current usage metrics is available 48-96 hours after online publication and is updated daily on week days.
Initial download of the metrics may take a while.