Fig. 1.
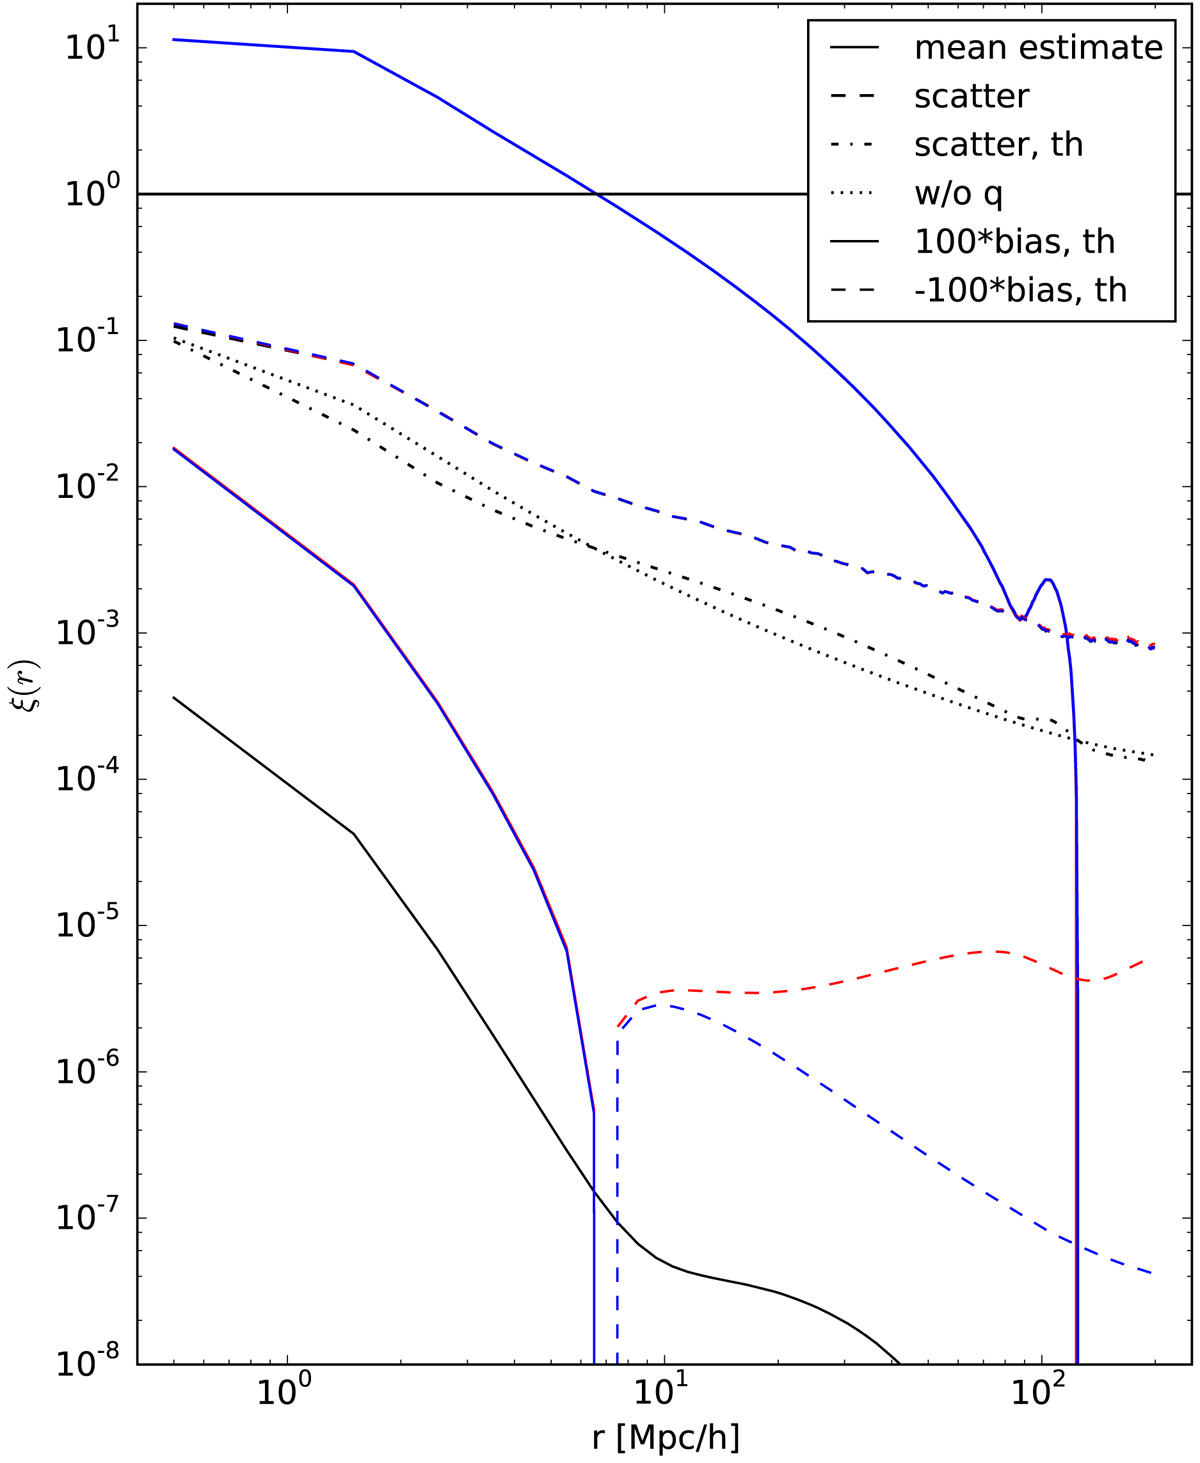
Mean ξ(r) estimate and the scatter and theoretical bias of the estimates for different estimators. The dash-dotted line, our theoretical result for the scatter of the LS method, underestimates the scatter, since higher-order correlations in the D catalog are ignored. The dotted line is without the contribution of the q terms, and is dominated by the Poisson (p) terms. The bias is multiplied by 100 so the curves can be displayed in a more compact plot. For the measured mean and scatter, and the theoretical bias we plot standard LS in black, dilution with d = 0.14 in red, and split with Ms = 50 in blue. For the mean and scatter the difference between the methods is not visible in this plot. The differences in the mean estimate are shown in Fig. 5. The differences in scatter (or its square, the variance) are shown in Fig 3. For the theoretical bias the difference between split and dilution is not visible at small r (ξ(r) > 1), where the bias is positive.
Current usage metrics show cumulative count of Article Views (full-text article views including HTML views, PDF and ePub downloads, according to the available data) and Abstracts Views on Vision4Press platform.
Data correspond to usage on the plateform after 2015. The current usage metrics is available 48-96 hours after online publication and is updated daily on week days.
Initial download of the metrics may take a while.