| Issue |
A&A
Volume 631, November 2019
|
|
|---|---|---|
| Article Number | A29 | |
| Number of page(s) | 13 | |
| Section | Atomic, molecular, and nuclear data | |
| DOI | https://doi.org/10.1051/0004-6361/201935618 | |
| Published online | 15 October 2019 | |
MCDHF and RCI calculations of energy levels, lifetimes, and transition rates in Si III and Si IV⋆
1
Department of Physics, Lund University, Post Office Box 118, 22100 Lund, Sweden
e-mail: This email address is being protected from spambots. You need JavaScript enabled to view it.
2
Department of Physics, Çanakkale Onsekiz Mart University, Çanakkale, Turkey
e-mail: This email address is being protected from spambots. You need JavaScript enabled to view it.
3
Materials Science and Applied Mathematics, Malmö University, 20506 Malmö, Sweden
4
Institute of Modern Physics, Fudan University, Shanghai, PR China
Received:
4
April
2019
Accepted:
4
August
2019
Abstract
We present extensive multiconfiguration Dirac-Hartree-Fock and relativistic configuration interaction calculations including 106 states in doubly ionized silicon (Si III) and 45 states in triply ionized silicon (Si IV), which are important for astrophysical determination of plasma properties in different objects. These calculations represents an important extension and improvement of earlier calculations especially for Si III. The calculations are in good agreement with available experiments for excitation energies, transition properties, and lifetimes. Important deviations from the NIST-database for a selection of perturbed Rydberg series are discussed in detail.
Key words: atomic data
Tables 1 and 2 are only available at the CDS via anonymous ftp to cdsarc.u-strasbg.fr (130.79.128.5) or via http://cdsarc.u-strasbg.fr/viz-bin/cat/J/A+A/631/A29
© ESO 2019
1. Introduction
Silicon is one of the most abundant elements on Earth and in the Universe. Due to its high abundance, the lowest ionization ions of Silicon, SiI-IV, play important roles in the diagnostics and modeling of various astrophysical (Becker & Butler 1990; Catanzaro et al. 2008; Iijima & Nakanishi 2008) and laboratory plasmas (Cowpe et al. 2008; Yamazaki et al. 2009; Ogilvie & Nicolich 2009). Si I and Si II have been extensively studied both experimentally and theoretically, see for example Pehlivan Rhodin (2018) and references given therein.
Lines from Si III and Si IV are observed in the spectra of several different astronomical objects, for example the solar corona and transition region, early-type stars, planetary nebulae, novae, and the interstellar medium, where they have been used for diagnostics of the plasma parameters (Dufton et al. 1983; Nussbaumer 1986; Rubin et al. 1993). As an example, Dufton et al. (1983) used the Si III emission lines observed by Skylab to determine the electron density of the solar corona. Discrepancies between observed and predicted Si III line ratios involving the intercombination line 3s2 1S0 − 3s3p 3P1 at 1892 Å and the higher excitation 3s3p 1P1 − 3s4s 1S0 at 1313 Å were found. The authors suggested it may have been caused by the presence of a non-Maxwellian electron distributions changing the intensity ratio between the lines. The energy of the upper level of the 1313 Å line is considerably higher than the average electron thermal energy, and the excitation from the ground state can be increased by high-energy electrons (Pinfield et al. 1999). Similarly, Keenan et al. (1989) presented Spacelab 2 observations and Pinfield et al. (1999) presented spectra from the Solar Ultraviolet Measurements of Emitted Radiation (SUMER) instrument on-board the Solar and Heliospheric Observatory (SOHO) to give a deeper analysis of possible non-Maxwellian emission-line enhancement in different solar regions. The suggestion of the presence of non-Maxwellian electron distributions was followed up by Dzifčáková & Kulinová (2011). More recently, Del Zanna et al. (2015) investigated the main spectral diagnostics for Si III ultraviolet lines, to measure electron densities and temperatures. However, they found no conclusive evidence for the presence of non-Maxwellian electron distributions from observations of the low transition region of the solar atmosphere, based on R-matrix scattering calculations for electron collisional excitation of Si III, carried out with the intermediate-coupling frame transformation method. The updated and more accurate atomic data of Si III in the present paper, can be used for rederivation of the plasma diagnostics using existing solar observations.
Due to their relatively high ionization energies, lines from Si III and Si IV appear in early-type stars, for example B-type stars, which are massive stars with surface temperatures 10 000–30 000 K showing strong Si III and Si IV lines in their optical spectra. The present-day chemical abundances of the Galaxy in the solar vicinity, can be determined by studying B-type main sequence stars due to their short lifetimes (Przybilla et al. 2008; Simón-Díaz 2010). The silicon ionization balance is used as the temperature diagnostics in the B-type star temperature range. Becker & Butler (1990) used Si III and Si IV spectral lines to determine the temperature, whereas Monteverde et al. (2000) studied the ionization equilibria of Si III compared to Si II and Si IV, respectively, to find the Si-abundance. A recent study by Nieva & Przybilla (2012) analyzed 29 early B-type stars in OB associations with a thorough and self-consistent analysis technique. They found the present-day Solar neighborhood to be chemically homogeneous, indicating abundance fluctuations of less than 10% around the mean. Bailey & Landstreet (2013) carried out a study on the determination of the abundance of Si to clarify discordant results in mid to late B-type stars.
The atomic data parameters, particularly transition rates, are essential in the abundance determination and plasma modeling. The work presented here therefore aims to provide accurate atomic data for a large part of the Si III and Si IV spectrum.
2. Previous work on atomic data for Si III and Si IV
Berry et al. (1971) and Livingston et al. (1976a),b) performed radiative lifetime measurements in Si III and Si IV using the beam-foil technique. Kwong et al. (1983) used a radio-frequency ion trap to measure the lifetime of the long-lived 3s3p 3P level of Si III by observation of the decay to the ground state at 1892 Å and obtained an A-value of (1.67 ± 0.1)×104 s−1. This result has been included in many later plasma models. Later studies, for instance Ojha et al. (1988), confirm this value.
On the theoretical side, Nussbaumer (1986) used a multiconfiguration approach with an adjustable Thomas–Fermi potential to determine the transition probabilities for the 17 lowest terms in Si III. They applied various semi-empirical corrections based on the observed energies to improve the accuracy in the term energies. Butler et al. (1993) computed the radiative data for the 3l3l′ transitions, for Si III and other Mg-like ions of astrophysical interests by using the close-coupling approximation with a modified version of the R-Matrix code as a part of the international Opacity project (Seaton 1987). Safronova et al. (2000) used relativistic second-order many body perturbation theory (MBPT) to calculate excitation energies and transition rates for the same transition arrays. Almaraz et al. (2000) applied the CIV3 code (Hibbert 1975) to calculate energy levels and oscillator strengths in Si III.
In more recent studies, Del Zanna et al. (2015) performed a large-scale R-matrix scattering calculation providing 149 LS terms and 283 fine-structure levels arising from 3snl, 3pnl and 3dnl configurations with n ≤ 5 and l ≤ 4. Aggarwal (2017) reported energies and lifetimes for the 141 levels of the 3l3l′ and 3l4l′ configurations and radiative rates for four types of transitions (E1, E2, M1, and M2) in Si III. Iorga & Stancalie (2018) investigated the effect of core-valence and core-core correlations on the energy levels and transition probabilities in the Mg isoelectronic sequence using the Flexible Atomic Code (FAC; Gu 2008). The results contained the energy of the levels arising from the valence configurations along with transition rates corresponding to E1, M1, E2, M2 transitions between states arising from 3l3l′ with l, l′≤2 and 3snl″ with n ≤ 7 and l″ ≤ 4 configurations.
Froese Fischer et al. (2006) performed extensive and highly accurate multiconfiguration Hartree-Fock (MCHF) calcul- ations for the Mg-like sequences (Z = 12, …, 26). They used Breit-Pauli approximation to include relativistic effects. They computed both allowed (E1) and some forbidden (E2, M1, M2) transitions.
For triply ionized silicon Maniak et al. (1993) performed radiative lifetime measurements of 3p, 3d, and 4s levels using the beam-foil technique. Theodosiou & Curtis (1988) used a semi-empirical quantum defect approach to calculate lifetimes for the 3p 2P1/2, 3p 2P3/2, 3d 2D3/2, and 3d 2D5/2 levels in the Na isoelectronic sequence. These calculations reached a fair agreement with experiments, but deviated from some ab initio results. Siegel et al. (1998) used a semi-empirical model potential approach to compute electric dipole transition oscillator strengths for low-lying transitions in the Na isoelectronic sequence (Na I–Ca X). The core polarization effects were explicitly included in the calculations. Siems et al. (2001) presented oscillator strengths and lifetimes for Si IV using a multiconfiguration Hartree-Fock relativistic (HFR) approach. In recent years, Nandy & Sahoo (2015) carried out calculations of the relativistic sensitivity coefficients, oscillator strengths, transition probabilities, lifetimes, and magnetic dipole hyperfine structure constants for a number of low-lying states in the Zn II, Si IV, and Ti IV. Safronova et al. (1998) carried out all-order relativistic many-body calculations of removal energies and hyperfine constants for 3s, 3p1/2, 3p3/2, 3d3/2,3d5/2, and 4s states of Na-like ions with Z = 11 − 16. The reduced dipole matrix elements were determined for 3p1/2 − 3s, 3p3/2 − 3s, 4s−3p1/2, 4s−3p3/2, 3d3/2 − 3p1/2, 3d3/2 − 3p3/2, and 3d5/2 − 3p3/2 electric-dipole transitions. The calculations included single and double excitations of the Hartree–Fock ground state to all orders in perturbation theory. Theoretical fine-structure intervals had an agreement with measurements to about 0.3% for 3p states and to about 3% for 3d states. Theoretical hyperfine constants and line strengths agreed with the precise measurements to better than 0.3%. Finally, Froese Fischer et al. (2006) performed extensive ab initio non-orthogonal spline CI calculations for the Na-like sequence. Kelleher & Podobedova (2008) presented the latest compilation of Si III and Si IV transition rates.
3. Theory
In this work, the calculations were performed using the fully relativistic multi-configuration Dirac-Hartree-Fock (MCDHF) method in jj-coupling (Grant 2007; Froese Fischer et al. 2016).
3.1. Multiconfiguration Dirac-Hartree-Fock
An electronic state of a many electrons system is determined by a wave function Ψ, which is a solution to the wave equation:
 (1)
(1)
where H is the Hamiltonian operator and E is the total energy of the system. The common starting point of the MCDHF method is the Dirac-Coulomb Hamiltonian:
 (2)
(2)
where Vnuc(ri) is the monopole part of the electron-nucleus Coulomb interaction, rij is the distance between electrons i and j, α and β are the 4-by-4 Dirac matrices, and c is the speed of light.
The approximate solutions to the wave equations are referred to as atomic state functions (ASFs). An atomic state function, Ψ(γPJ), is in our approach represented by a linear combination of configuration state functions (CSFs),
 (3)
(3)
where P is the parity and J is the total angular momentum. γj represents all necessary quantum numbers and the orbital occupancy to define the CSF, while cj are the mixing coefficients. The γ is usually selected as the γj corresponding to the largest weight |cj|2.
The CSFs are in turn constructed as angular-momentum-coupled, anti-symmetrized products of one-electron Dirac-orbitals of the form
 (4)
(4)
where Pnκ(r) and Qnκ(r) are the large and small components of the radial wave function, and χ±κ, m(θ, φ) are two-component spin-orbit functions.
The extended optimal level (EOL) scheme is used to determine energies and wave functions. In the EOL scheme, the radial parts of the Dirac orbitals and the expansion coefficients of the targeted states are optimized to self-consistency by solving the MCDHF equations, which are derived using the variational approach (Dyall et al. 1989). In subsequent relativistic configuration interaction (RCI) calculations the transverse photon interaction (Breit interaction)
![Mathematical equation: $$ \begin{aligned} H_{\rm Breit}=&-\sum _{i<j}^N \Bigg [\boldsymbol{\alpha }_i\cdot \boldsymbol{\alpha }_j\frac{\cos ({ w}_{ij}r_{ij}/c)}{r_{ij}} \nonumber \\&+ \left(\boldsymbol{\alpha }_i\cdot \boldsymbol{\nabla }_i\right)\left(\boldsymbol{\alpha }_i\cdot \boldsymbol{\nabla }_j\right) \frac{\cos ({ w}_{ij}r_{ij}/c)-1}{{ w}_{ij}^2r_{ij}/c^2}\Bigg ] \end{aligned} $$](/articles/aa/full_html/2019/11/aa35618-19/aa35618-19-eq6.gif) (5)
(5)
may be included in the Hamiltonian (McKenzie et al. 1980). The photon frequency wij, used by the RCI program in calculating the matrix elements of the transverse photon interaction, is taken as the difference of the diagonal Lagrange multipliers associated with the orbitals. The leading quantum electrodynamic (QED) corrections effects, in the form of self-energy and vacuum polarization, are also included. The CSFs are given in the jj-coupling scheme during this procedure, but to make a comparison with experiments more feasible, we transform the resulting wave function to the LSJ-coupling scheme, using the JJ2LSJ program (Gaigalas et al. 2003, 2004, 2017) part of the GRASP2K code (Jönsson et al. 2013). All the calculations were performed with an updated parallel version of the GRASP2K code by Jönsson et al. (2013). To calculate the spin-angular part of the matrix elements, the second quantization method in coupled tensorial form and quasispin technique (Gaigalas et al. 1997, 2001) were adopted.
3.2. Computation of transition parameters
Once well-converged and effectively complete ASFs have been obtained radiative transition such as transition probabilities and weighted oscillator strengths can be determined. The transition parameters between two states γJM and γ′J′M′ are expressed in terms reduced matrix elements
 (6)
(6)
where T is the transition operator (Grant 1974).
For electric multipole transitions, there are two forms of the transition operator, the length (Babushkin gauge) and velocity (Coulomb gauge) forms (Grant 1974). Due to the definition of these two, the length form is more sensitive to the outer part of the wave functions, which are usually active in radiative transitions. A number of studies have shown that the length form generally gives more reliable values at a given level of valence and core-valence electron correlation although the velocity form seems to be more stable for transitions including highly excited Rydberg states (Pehlivan Rhodin et al. 2017). It is common to use the agreement between transition rates Al and Av computed in two forms as an indicator of accuracy of the wave functions (see review by Froese Fischer 2009; Ekman et al. 2014). A possible measure of this is the quantity dT, characterizing the uncertainty of the calculated transition rates and defined as
 (7)
(7)
where Al and Av are the transition rates in length and velocity forms respectively. The values of dT do not represent uncertainty estimates for each individual transition but should be considered as statistical indicators of uncertainties within given sets of transitions.
4. Calculations
Our MCDHF and RCI calculations for doubly and triply ionized silicon started by defining a multireference (MR) set of configurations. From this we allow single and double substitutions to a systematically increasing active set of orbitals.
4.1. Si III
In doubly ionized silicon, calculations were performed for states belonging to the 3s2, the 3p2; the 3p4p; the 3sns with n = 4, …, 9; the 3snd with n = 3, …, 8; the 3sng with n = 5, …, 8 even configurations and furthermore, the 3snp with n = 3, …, 9; the 3snf with n = 4, …, 8; the 3pnd with n = 3, 4; and the 3p4s odd configurations. These configurations define the MR for the even and odd parities, respectively. Terms involving configurations with n = 8 and 9 do not belong to our targeted states but they are taken into account to obtain orbitals with large radii to get a reasonable agreement between length and velocity form for the transition properties, see Pehlivan Rhodin et al. (2017).
In the first step of our calculations, an initial MCDHF calculation in the EOL scheme (Dyall et al. 1989) was performed simultaneously for all even and odd multireference states. These initial calculations were followed by calculations with expansions including the configuration state functions (CSFs) obtained by single (S), double (D) substitutions of electrons from the spectroscopic reference configurations to the active set of orbitals (Olsen et al. 1988; Sturesson et al. 2007).
In an restricted active set approach (RAS) restrictions are put on the allowed substitutions from the MR, when generating the full space of CSFs. We therefore define the valence region of the atom as the two outer electrons, outside the 1s22s22p6 core subshells. We kept the 1s2-subshell fixed in all calculations, that is, not allowing substitutions from it. After optimizing simultaneously the even and odd states of the MR-set in the first step of calculations, our goal was to include valence-valence (VV) and core-valence (CV) interaction to convergence. We optimized four layers of correlation orbitals based on the VV correlation, only allowing SD substitutions from the valence subshells. The orbitals in the active set were systematically extended to include orbitals up to the 13s,13p,12d,12f,12g, and 9h in the final correlation layer. These MCDHF calculations were followed by RCI calculations including Breit-interaction and some QED effects as described above.
As a final step of our work, an RCI calculation was performed. The expansion for that RCI calculation was obtained by augmenting the largest SD valence expansion with a CV expansion. The CV expansion was generated by SD substitutions from the valence orbitals and the 2p6 core with the restriction that there should be at the most one substitution from the 2s or 2p subshells. We neglected core-core (CC) correlation, meaning more than one excitation from the core, which was comparatively unimportant for both the energy separations and the transition probabilities (Zou & Fischer 2000). The resulting expansions consisted of 1 401 150 and 1 760 209 CSFs distributed over the J = 0, 1, …, 6 symmetries for even and odd parity, respectively.
4.2. Si IV
In triply ionized silicon, calculations were performed for states belonging to the configurations 2s22p6nl where n ≤ 9 and l ≤ 6, defining the MR configurations. We again added two more layers of spectroscopic orbitals, n = 8, 9, in comparison with the states we were targeting to get a reasonable agreement between length and velocity form for the transition properties.
As a starting point for the calculations, MCDHF calculations in the EOL scheme were performed for the even and odd parity states in the MR simultaneously. The initial calculations were followed by separate calculations in the EOL scheme for the even and odd parity states, where the CSFs were obtained by allowing SD substitutions from the configurations in the MR to active orbital sets, which were consecutively enlarged by layers of correlation orbitals. Si IV has one electron outside closed subshells, and consequently there is no VV correlation. The corrections to our results can therefore be classified as CV and CC correlations. The major effect comes from the CV correlation. The CV expansion was obtained by restricting the substitutions in such a way that only one substitution was allowed from the 2s or 2p subshells of the configurations in the MR, and no substitutions from the 1s shell, this means that 1s shell was an inactive closed core.
The active sets of orbitals for the even and odd parity states were extended by layers to include orbitals with quantum numbers n ≤ 12 and l ≤ 6. Each MCDHF calculation was followed by RCI calculations, including the Breit-interaction and leading QED effects. We investigated the CC correlation effects by optimizing one layer of orbitals n = 13 on SD from the 2s22p6 core in an RCI calculation as a final step of our work. The number of CSFs in the final even and odd state expansions were approximately 995 020 and 993 501, respectively, distributed over the different J symmetries.
5. Results
5.1. Si III
We present in Table A.1 the computed excitation energies in Si III for increasing active sets of orbitals labeled with the highest principal quantum number n of the orbitals in the active set. The calculations including only VV correlation, built on three layers of correlation orbitals, is followed by finally including the CV correlation using an RCI-approach.
The computed excitation energies are in good agreement with the values from the NIST-database (Kramida et al. 2018). For the VV correlation, the mean relative difference between theory and experiment is of the order of 0.9%. The inclusion of CV correlation effects improves the energies dramatically since the values for all computed energy separations have converged.
The final excitation energies are in good agreement with the experimental ones, with a mean difference of only 0.05%. For comparison, the experimental energies from the NIST Atomic Spectra Database (Kramida et al. 2018) and also the differences ΔE, between the observed energies and the final computed excitation energies, are given in Table A.1.
There is excellent agreement between observations and calculations for most of the levels, with a few important exceptions, due to mislabeling of levels. The NIST label classification for Si III is based on the analysis done by Toresson (1961). Since then the NIST designations for the 3p3d 1P and the 3p4s 1P have been interchanged as recommended by Victor et al. (1976) and Zetterberg & Magnusson (1977). The assignments for 3p3d 1P and 3p3d 1F levels have been questioned previously by Reistad et al. (1984) and Brage & Hibbert (1989).
If we start by investigating the 1Fo-levels, we note that the 3p3d 1Fo perturbs the 3snf Rydberg series. This perturbation has been studied by a number of authors along the Mg-sequence (Brage & Hibbert 1989; Reistad et al. 1984; Aashamar et al. 1986). The NIST classification identifies the level at 235 413 cm−1 as 3p3d 1F for convenience, even though the calculated composition is 65% 3snf (Froese Fischer & Godefroid 1982). To illustrate the complexity of the situation, we show the composition of the 1F levels in Fig. 1. It is clear that the 3p3d 1F is not the major component for any state and that the same CSF 3s5f 1Fo is the largest component for two levels. We therefore choose to change the designation as shown in Table A.1 where these two levels are labeled as 3s5f 1F and 3s5f 1F
 , respectively.
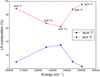 |
Fig. 1. 3p3d and 3snf composition of 1Fo Rydberg series members. |
Our second example of a strongly perturbed series investigated by Froese Fischer & Godefroid (1982) is a short-range interaction of the plunging configuration 3p3d 1P with the 3snp 1P Rydberg series. In Si III the 3s6p 1P1 and 3p3d 1P1 are close to degenerate and the labeling of these levels is hard to reproduce. A closer look at the LS-percentage composition and excitation energies of 3snp 1P and 3p3d 1P are shown in Fig. 2, where the level at 234 923 cm−1 is best represented as 3p3d 1P. Also in this case we adjust the labels from NIST.
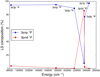 |
Fig. 2. 3pnd 1P and 3snp composition of 1Po Rydberg series members. |
A third example of a complicated case of level-designation is the 3snd 1De Rydberg series, which is perturbed by the 3p21D for low excitations and the 3p4p 1D2 for n = 6 − 8. In our calculations the level energy of 3s7d 1D2 is 247 946 cm−1, while the values given by NIST is 250 636 cm−1. However, the LS composition of the former level is 72% 3s7d 1D2 and 18% 3p4p 1D2. We suggest that the NIST identification of the level 1D2 at 250 636 cm−1 and at 247 935 cm−1 should be interchanged as shown in Table A.1.
A problem in spectroscopic calculations, that includes a large number of states, is to reproduce very close degeneracy between some levels. An example of this is the relative position of the singlet and triplet levels the 3snp Rydberg series with n = 6 − 7. It is clear that we are not able to reproduce the NIST-values for the relative position of these levels, which makes, for example, our values for intercombination lines inaccurate from the 3s6p and 3s7p 3P-levels.
In Table A.2, the current results for the 29 lowest excitation energies of Si III are compared with the ones from the MCHF-BP calculations by Froese Fischer et al. (2006) and R-matrix calculations by Del Zanna et al. (2015). To make the comparison easier the differences between observed and computed energies are also given in the last columns for the different computational approaches. From the comparison, it is clear that the agreement with the present RCI calculations and the MCHF-BP calculations is very good. Furthermore, the agreement between the current RCI results and the observed energies is improved especially above the 3p2 1S0 level.
The complete transition data table, using the length form of transition operator, including rates, weighted oscillator strengths, wavenumber, and the uncertainty in the computed rates, for E1 transitions in Si III for the wavelength range of 40–18 239 nm is available at the CDS. The wavenumber and wavelength values are changed to match the values in the NIST database, which are the values from Reader et al. (1980). Uncertainties of the transition rates have been estimated from the expressions suggested by Ekman et al. (2014). The estimated relative uncertainties for most of the strong transitions are below 1%. For many weak transitions the uncertainties are around 10%. However, for weak intercombination transitions the uncertainties are considerably large due to difficulties in calculating the transition rates of intercombination lines. There are some weak two-electron one-photon transitions with large uncertainties. These transitions are zero in the single configuration approximation and are allowed only through correlation effects. Thus, the two-electron one-photon transitions are very difficult to compute and the uncertainties are often large.
The 3s4s 1S0 → 3s3p 1P1 transition is of special importance in the diagnostics of non-Maxwellian electron distributions, as discussed above. According to Dufton et al. (1983) the rate for this transition is 2.8 × 10⁸ s−1, while Nussbaumer (1986) predicted 4.0 × 10⁸ s−1 and Del Zanna et al. (2015) 2.96 × 10⁸ s−1. Our result for this rate is 8.53 × 10⁸ s−1 close to Froese Fischer et al. (2006) calculation of 8.99 × 10⁸ s−1.
Our estimated lifetimes (including only E1-transitions) for excited states of Si III are given in Table A.3. We also compare our results to available measurements in this table. Berry et al. (1971), Livingston et al. (1976b) and Bashkin et al. (1980) measured the lifetimes for a few levels in Si III with the beam foil method. The agreement between the current RCI results and measurements is quite satisfactory, though the results from the measurements of Berry et al. (1971) slightly differ from the RCI values. This may be explained by the uncertainties in the beam-foil method discussed by Zou et al. (1999). The lifetimes from the current RCI calculations are also compared to results from the MCHF-BP calculations by Froese Fischer et al. (2006) and MBPT calculations by Safronova et al. (2000), when these include all important transitions from a given state. The overall agreement is good, giving us confidence in the present results. For most states there is no major discrepancy between the current results and MBPT results except for the 3p3d 3F states. The reason for that is unclear, but for the rest of the states the discrepancies are quite small.
5.2. Si IV
In Table A.4, we present the level energies of the lowest 45 levels in Si IV as functions of increasing active sets of orbitals (labeled by the highest principal quantum number n). The calculations are based on CV correlation, including three layers of correlation orbitals. From the inspection of Table A.4, it is clear that the present calculations are well converged with respect to the increasing orbital set. The inclusion of CC correlation effects, adding one more layer of correlation orbitals with n = 13, improves the energies and the final energies are in good agreement with experiment displaying a mean difference of 0.09%. We present the experimental level energies from the NIST- database for Si IV in Table A.4, including the differences between the observed and the computed energies. In Table A.4, we also compare the present computed excitation energies with those from the non-orthogonal B-spline CI method (Zatsarinny & Fischer 2002) by Froese Fischer et al. (2006) for Si IV, showing excellent agreement.
The complete transition data table, using the length form of transition operator, including rates, weighted oscillator strengths, wavenumber, and the uncertainty in the computed rates, for E1 transitions in Si IV for the wavelength range of 31–11 933 nm can be found at the CDS. Uncertainties of the transition rates have been estimated from the expressions suggested by Ekman et al. (2014). The wavelength and wavenumber values are changed to match the values in the NIST database, which are the values from Reader et al. (1980). In general, the estimated relative uncertainties for most of the transitions are less than 10%. However, for some transitions the uncertainties are very large mostly due to difficulties in calculating the transition rates of intercombination lines and two-electron transitions.
Table A.5 presents our estimated lifetimes of the excited states (including only E1-transitions) in both length and velocity forms. The average relative difference between lifetimes in two forms is ∼0.8%, which is highly satisfactory. This difference might be considered to be an internal validation of the accuracy of the calculations. The comparison of our results with previously reported theoretical and experimental values are also given in Table A.5. Siems et al. (2001) performed a HFR approach to estimate the lifetimes for Si IV. In that approach, the electrostatic parameters were optimized using a least-squares procedure. Berry et al. (1971) and later Bashkin et al. (1980) measured lifetimes using the beam-foil method. The overall agreement between these measured lifetimes and the current lifetimes is rather good. From the table, one can see that our results are in excellent agreement with the results of Froese Fischer et al. (2006) and Siems et al. (2001).
6. Conclusions
In this work, we performed self-consistent MCDHF and subsequent RCI calculations for Si III and Si IV, as an extension and update to earlier calculations. Previous theoretical and experimental data were used to validate our results. Excitation energies from the RCI calculations are in a very good agreement with available observations. Our present study is an extension to the most accurate MCHF-BP and the BSR_CI calculations, and in general in excellent agreements with them. The presented results significantly increase the amount of accurate energy data of astrophysical interest for the two Si-ions. The highly accurate atomic data helps to correct interpretation of the lines. Therefore, we recommend our present results based on a fully relativistic method for abundance analysis and plasma diagnostics.
Acknowledgments
Betül Atalay acknowledges financial support from the Scientific and Technological Research Council of Turkey (TUBITAK) – BIDEB 2219 International Post-Doctoral Research Fellowship Program. Tomas Brage, Per Jönsson, and Henrik Hartman acknowledge support from the Swedish Research Council (VR) under contract No. 2015-04842. Dr Atalay also would like to express her appreciation of the hospitality shown by the Division of Mathematical Physics at Lund University and by the Department of Materials Science and Applied Mathematics at Malmö University.
References
- Aashamar, K., Luke, T. M., & Talman, J. D. 1986, Phys. Scr., 34, 386 [NASA ADS] [CrossRef] [Google Scholar]
- Aggarwal, K. M. 2017, At. Data Nucl. Data Tables, 117, 320 [NASA ADS] [CrossRef] [Google Scholar]
- Almaraz, M. A., Hibbert, A., Lavín, C., Martín, I., & Bell, K. L. 2000, J. Phys. B: At. Mol. Opt. Phys., 33, 3277 [NASA ADS] [CrossRef] [Google Scholar]
- Bailey, J. D., & Landstreet, J. D. 2013, A&A, 551, A30 [NASA ADS] [CrossRef] [EDP Sciences] [Google Scholar]
- Bashkin, S., Astner, G., Mannervik, S., et al. 1980, Phys. Scr., 21, 820 [NASA ADS] [CrossRef] [Google Scholar]
- Becker, S. R., & Butler, K. 1990, A&A, 235, 326 [NASA ADS] [Google Scholar]
- Berry, H. G., Bromander, J., Curtis, L. J., & Buchta, R. 1971, Phys. Scr., 3, 125 [NASA ADS] [CrossRef] [Google Scholar]
- Brage, T., & Hibbert, A. 1989, J. Phys. B: At. Mol. Opt. Phys., 22, 713 [NASA ADS] [CrossRef] [Google Scholar]
- Butler, K., Mendoza, C., & Zeippen, C. J. 1993, J. Phys. B: At. Mol. Opt. Phys., 26, 4409 [NASA ADS] [CrossRef] [Google Scholar]
- Catanzaro, G., Leone, F., Busá, I., & Romano, P. 2008, New Astron., 13, 113 [NASA ADS] [CrossRef] [Google Scholar]
- Cowpe, J., Astin, J., Pilkington, R., & Hill, A. 2008, Spectrochim. Acta Part B: At. Spectr., 63, 1066 [NASA ADS] [CrossRef] [Google Scholar]
- Del Zanna, G., Fernández-Menchero, L., & Badnell, N. R. 2015, A&A, 574, A99 [NASA ADS] [CrossRef] [EDP Sciences] [Google Scholar]
- Dufton, P. L., Hibbert, A., Kingston, A. E., & Doschek, G. A. 1983, ApJ, 274, 420 [NASA ADS] [CrossRef] [Google Scholar]
- Dyall, K. G., Grant, I. P., Johnson, C. T., Parpia, F. A., & Plummer, E. P. 1989, Comput. Phys. Commun., 55, 425 [NASA ADS] [CrossRef] [Google Scholar]
- Dzifčáková, E., & Kulinová, A. 2011, A&A, 531, A122 [NASA ADS] [CrossRef] [EDP Sciences] [Google Scholar]
- Ekman, J., Godefroid, M., & Hartman, H. 2014, Atoms, 2, 215 [NASA ADS] [CrossRef] [Google Scholar]
- Froese Fischer, C. 2009, Phys. Scr. T, 134, 014019 [Google Scholar]
- Froese Fischer, C., & Godefroid, M. 1982, Phys. Scr., 25, 394 [NASA ADS] [CrossRef] [Google Scholar]
- Froese Fischer, C., Tachiev, G., & Irimia, A. 2006, At. Data Nucl. Data Tables, 92, 607 [NASA ADS] [CrossRef] [Google Scholar]
- Froese Fischer, C., Godefroid, M., Brage, T., Jönsson, P., & Gaigalas, G. 2016, J. Phys. B: At. Mol. Opt. Phys., 49, 182004 [NASA ADS] [CrossRef] [Google Scholar]
- Gaigalas, G., Rudzikas, Z., & Froese Fischer, C. 1997, J. Phys. B: At. Mol. Phys., 30, 3747 [Google Scholar]
- Gaigalas, G., Fritzsche, S., & Grant, I. P. 2001, Comput. Phys. Commun., 139, 263 [NASA ADS] [CrossRef] [Google Scholar]
- Gaigalas, G., Žalandauskas, T., & Rudzikas, Z. 2003, At. Data Nucl. Data Tables, 84, 99 [NASA ADS] [CrossRef] [Google Scholar]
- Gaigalas, G., Zalandauskas, T., & Fritzsche, S. 2004, Comput. Phys. Commun., 157, 239 [NASA ADS] [CrossRef] [Google Scholar]
- Gaigalas, G., Fischer, C., Rynkun, P., & Jönsson, P. 2017, Atoms, 5, 6 [NASA ADS] [CrossRef] [Google Scholar]
- Grant, I. P. 1974, J. Phys. B: At. Mol. Opt. Phys., 7, 1458 [NASA ADS] [CrossRef] [Google Scholar]
- Grant, I. 2007, in Relativistic Quantum Theory of Atoms and Molecules: Theory and Computation (Berlin: Springer), Springer Series on Atomic, Optical, and Plasma Physics [CrossRef] [Google Scholar]
- Gu, M. F. 2008, Can. J. Phys., 86, 675 [NASA ADS] [CrossRef] [Google Scholar]
- Hibbert, A. 1975, Comput. Phys. Commun., 9, 141 [NASA ADS] [CrossRef] [Google Scholar]
- Iijima, T., & Nakanishi, H. 2008, A&A, 482, 865 [NASA ADS] [CrossRef] [EDP Sciences] [Google Scholar]
- Iorga, C., & Stancalie, V. 2018, At. Data Nucl. Data Tables, 123, 313 [NASA ADS] [CrossRef] [Google Scholar]
- Jönsson, P., Gaigalas, G., Bieroń, J., Fischer, C. F., & Grant, I. P. 2013, Comput. Phys. Commun., 184, 2197 [NASA ADS] [CrossRef] [Google Scholar]
- Keenan, F. P., Cook, J. W., Dufton, P. L., & Kingston, A. E. 1989, ApJ, 340, 1135 [NASA ADS] [CrossRef] [Google Scholar]
- Kelleher, D. E., & Podobedova, L. I. 2008, J. Phys. Chem. Ref. Data, 37, 1285 [NASA ADS] [CrossRef] [Google Scholar]
- Kramida, A., Ralchenko, Yu, Reader, J., & NIST ASD Team 2018, NIST Atomic Spectra Database (ver. 5.5.6), [Online], Available: https://physics.nist.gov/asd [2018, April 16], National Institute of Standards and Technology, Gaithersburg, MD [Google Scholar]
- Kwong, H. S., Johnson, B. C., Smith, P. L., & Parkinson, W. H. 1983, Phys. Rev. A, 27, 3040 [NASA ADS] [CrossRef] [Google Scholar]
- Livingston, A. E., Baudinet-Robinet, Y., Garnir, H. P., & Dumont, P. D. 1976a, J. Opt. Soc. Am., 66, 1393 [NASA ADS] [CrossRef] [Google Scholar]
- Livingston, A. E., Kernahan, J. A., Irwin, D. J. G., & Pinnington, E. H. 1976b, J. Phys. B: At. Mol. Opt. Phys., 9, 389 [NASA ADS] [CrossRef] [Google Scholar]
- Maniak, S., Träbert, E., & Curtis, L. 1993, Phys. Lett. A, 173, 407 [NASA ADS] [CrossRef] [Google Scholar]
- McKenzie, B. J., Grant, I. P., & Norrington, P. H. 1980, Comput. Phys. Commun., 21, 233 [NASA ADS] [CrossRef] [Google Scholar]
- Monteverde, M. I., Herrero, A., & Lennon, D. J. 2000, ApJ, 545, 813 [NASA ADS] [CrossRef] [Google Scholar]
- Nandy, D. K., & Sahoo, B. K. 2015, MNRAS, 447, 3812 [NASA ADS] [CrossRef] [Google Scholar]
- Nieva, M. F., & Przybilla, N. 2012, A&A, 539, A143 [NASA ADS] [CrossRef] [EDP Sciences] [Google Scholar]
- Nussbaumer, H. 1986, A&A, 155, 205 [NASA ADS] [Google Scholar]
- Ogilvie, R. E., & Nicolich, J. 2009, Spectrochim. Acta Part B: At. Spectr., 64, 788 [NASA ADS] [CrossRef] [Google Scholar]
- Ojha, P. C., Keenan, F. P., & Hibbert, A. 1988, J. Phys. B At. Mol. Phys., 21, L395 [NASA ADS] [CrossRef] [Google Scholar]
- Olsen, J., Roos, B. O., Jørgensen, P., & Jensen, H. J. A. 1988, J. Chem. Phys., 89, 2185 [NASA ADS] [CrossRef] [Google Scholar]
- Pehlivan Rhodin, A. 2018, PhD Thesis, Lund University [Google Scholar]
- Pehlivan Rhodin, A., Hartman, H., Nilsson, H., & Jönsson, P. 2017, A&A, 598, A102 [NASA ADS] [CrossRef] [EDP Sciences] [Google Scholar]
- Pinfield, D. J., Keenan, F. P., Mathioudakis, M., et al. 1999, ApJ, 527, 1000 [NASA ADS] [CrossRef] [Google Scholar]
- Przybilla, N., Nieva, M.-F., & Butler, K. 2008, ApJ, 688, L103 [NASA ADS] [CrossRef] [Google Scholar]
- Reader, J., Corliss, C. H., Wiese, W. L., & Martin, G. A. 1980, Wavelengths and Transition Probabilities for Atoms and Atomic Ions: Part 1. Wavelengths, Part 2, Transition Probabilities (U.S. Government Printing Office) [Google Scholar]
- Reistad, N., Brage, T., Ekberg, J. O., & Engström, L. 1984, Phys. Scr., 30, 249 [NASA ADS] [CrossRef] [Google Scholar]
- Rubin, R. H., Dufour, R. J., & Walter, D. K. 1993, ApJ, 413, 242 [NASA ADS] [CrossRef] [Google Scholar]
- Safronova, M. S., Derevianko, A., & Johnson, W. R. 1998, Phys. Rev. A, 58, 1016 [NASA ADS] [CrossRef] [Google Scholar]
- Safronova, U. I., Johnson, W. R., & Berry, H. G. 2000, Phys. Rev. A, 61, 052503 [NASA ADS] [CrossRef] [Google Scholar]
- Seaton, M. J. 1987, J. Phys. B: At. Mol. Phys., 20, 6363 [NASA ADS] [CrossRef] [Google Scholar]
- Siegel, W., Migdalek, J., & Kim, Y.-K. 1998, At. Data Nucl. Data Tables, 68, 303 [NASA ADS] [CrossRef] [Google Scholar]
- Siems, A., Luna, F., & Trigueiros, A. 2001, J. Quant. Spectr. Radiat. Transf., 68, 635 [NASA ADS] [CrossRef] [Google Scholar]
- Simón-Díaz, S. 2010, A&A, 510, A22 [NASA ADS] [CrossRef] [EDP Sciences] [Google Scholar]
- Sturesson, L., Jönsson, P., & Froese Fischer, C. 2007, Comput. Phys. Commun., 177, 539 [NASA ADS] [CrossRef] [Google Scholar]
- Theodosiou, C. E., & Curtis, L. J. 1988, Phys. Rev. A, 38, 4435 [NASA ADS] [CrossRef] [Google Scholar]
- Toresson, Y. G. 1961, Ark. Fys. (Stockholm), 18, 389 [Google Scholar]
- Victor, G. A., Stewart, R. F., & Laughlin, C. 1976, ApJS, 31, 237 [NASA ADS] [CrossRef] [Google Scholar]
- Yamazaki, H., Yoshiki, M., Takemura, M., Tomita, M., & Takeno, S. 2009, Spectrochim. Acta Part B: At. Spectr., 64, 808 [NASA ADS] [CrossRef] [Google Scholar]
- Zatsarinny, O., & Fischer, C. F. 2002, J. Phys. B: At. Mol. Opt. Phys., 35, 4669 [NASA ADS] [CrossRef] [Google Scholar]
- Zetterberg, P. O., & Magnusson, C. E. 1977, Phys. Scr., 15, 189 [NASA ADS] [CrossRef] [Google Scholar]
- Zou, Y., & Fischer, C. F. 2000, Phys. Rev. A, 62, 062505 [NASA ADS] [CrossRef] [Google Scholar]
- Zou, Y., Hutton, R., Huldt, S., et al. 1999, Phys. Scr. T, 80, 460 [NASA ADS] [CrossRef] [Google Scholar]
Appendix A: Additional tables
Computed excitation energies in cm−1 for Si III from different computational models.
Observed and computed excitation energies for the 29 lowest states in Si III, from present calculations (ERCI) and other theoretical results (Etheor).
Results for Si III: Comparison between computed lifetimes, in length (τl) and velocity (τv) gauge, from our calculations.
Computed excitation energies in cm−1 for the 45 lowest states in Si IV, as a function of the increasing active set of orbitals, accounting for CV correlation, where n indicates the maximum principle quantum number of the orbitals included in the active set, as well as CC correlation.
Results for Si IV: Comparison between computed lifetimes, in length (τl) and velocity (τv) gauge, from our calculations.
All Tables
Computed excitation energies in cm−1 for Si III from different computational models.
Observed and computed excitation energies for the 29 lowest states in Si III, from present calculations (ERCI) and other theoretical results (Etheor).
Results for Si III: Comparison between computed lifetimes, in length (τl) and velocity (τv) gauge, from our calculations.
Computed excitation energies in cm−1 for the 45 lowest states in Si IV, as a function of the increasing active set of orbitals, accounting for CV correlation, where n indicates the maximum principle quantum number of the orbitals included in the active set, as well as CC correlation.
Results for Si IV: Comparison between computed lifetimes, in length (τl) and velocity (τv) gauge, from our calculations.
All Figures
|
Fig. 1. 3p3d and 3snf composition of 1Fo Rydberg series members. |
| In the text | |
|
Fig. 2. 3pnd 1P and 3snp composition of 1Po Rydberg series members. |
| In the text | |
Current usage metrics show cumulative count of Article Views (full-text article views including HTML views, PDF and ePub downloads, according to the available data) and Abstracts Views on Vision4Press platform.
Data correspond to usage on the plateform after 2015. The current usage metrics is available 48-96 hours after online publication and is updated daily on week days.
Initial download of the metrics may take a while.