Fig. 9
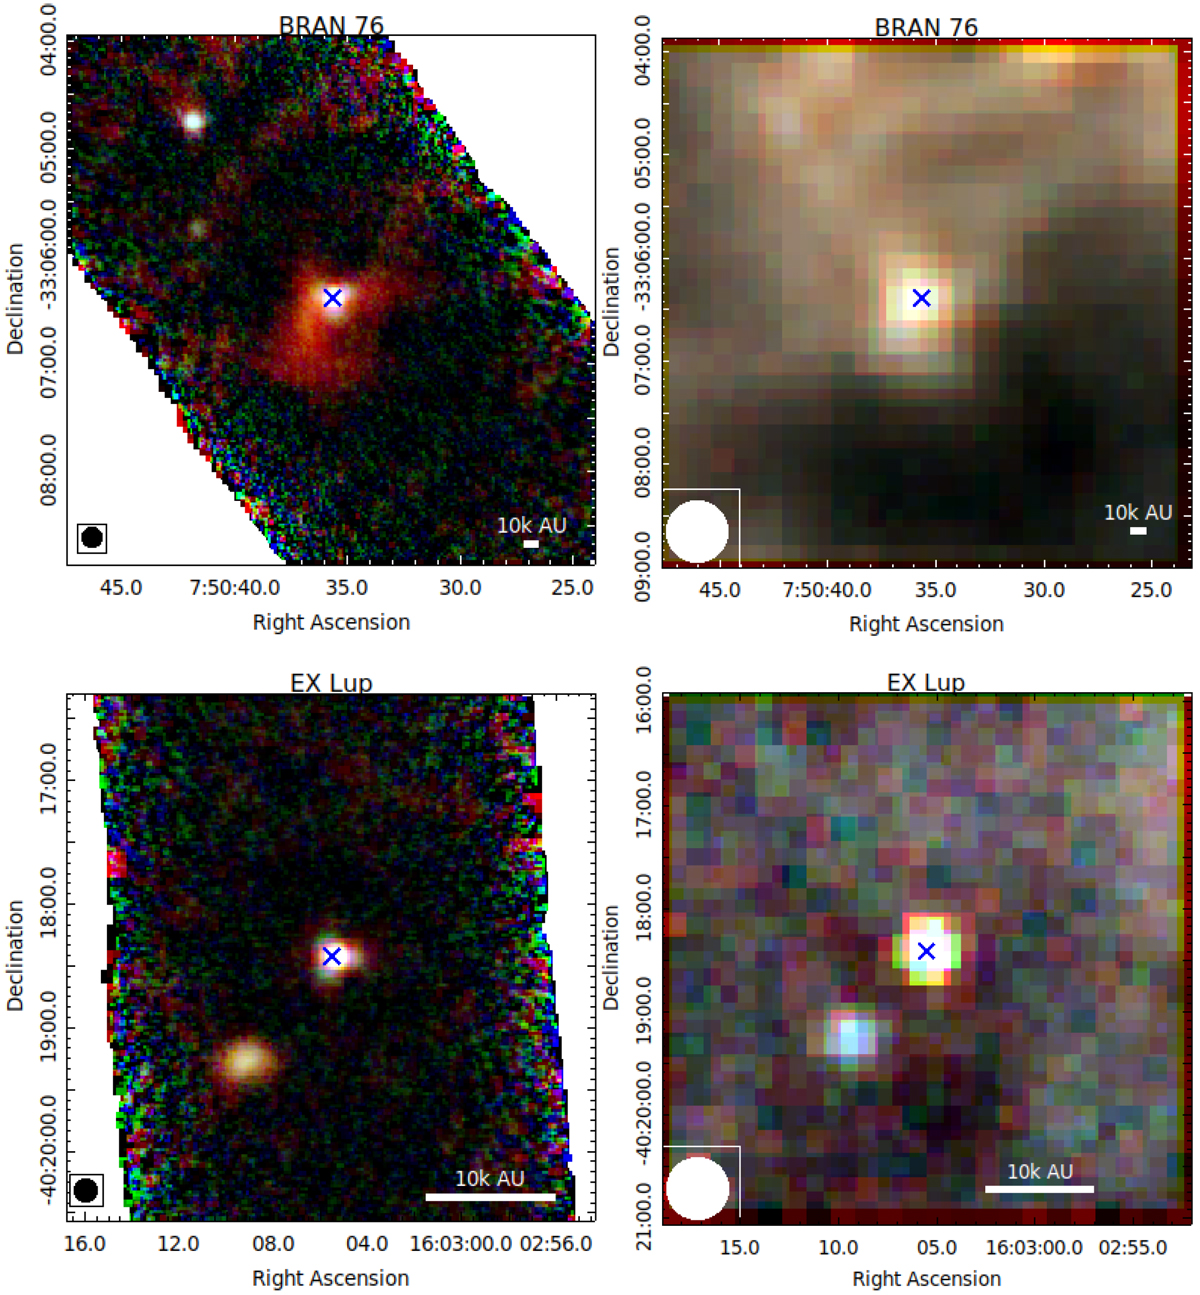
Three-color composed image of the 70 μm (blue), 100 μm (green), and 160 μm (red) photometry of PACS (left) and 250 μm (blue), 350 μm (green), and 500 μm (red) photometry of SPIRE (right) for Bran 76 (top) and EX Lup (bottom). The target coordinates of the FUor/EXor are shown with a blue cross. The circle in the lower left corner represents the beam for the longest used wavelength of the respective image (11.5″ for PACS, 35.95″ for SPIRE). For the PACS images we used an asinh scaling with 99.5% cutoff but removed values below zero. For SPIRE, we used a linear scale with 99.5% cutoff.
Current usage metrics show cumulative count of Article Views (full-text article views including HTML views, PDF and ePub downloads, according to the available data) and Abstracts Views on Vision4Press platform.
Data correspond to usage on the plateform after 2015. The current usage metrics is available 48-96 hours after online publication and is updated daily on week days.
Initial download of the metrics may take a while.