Fig. 8
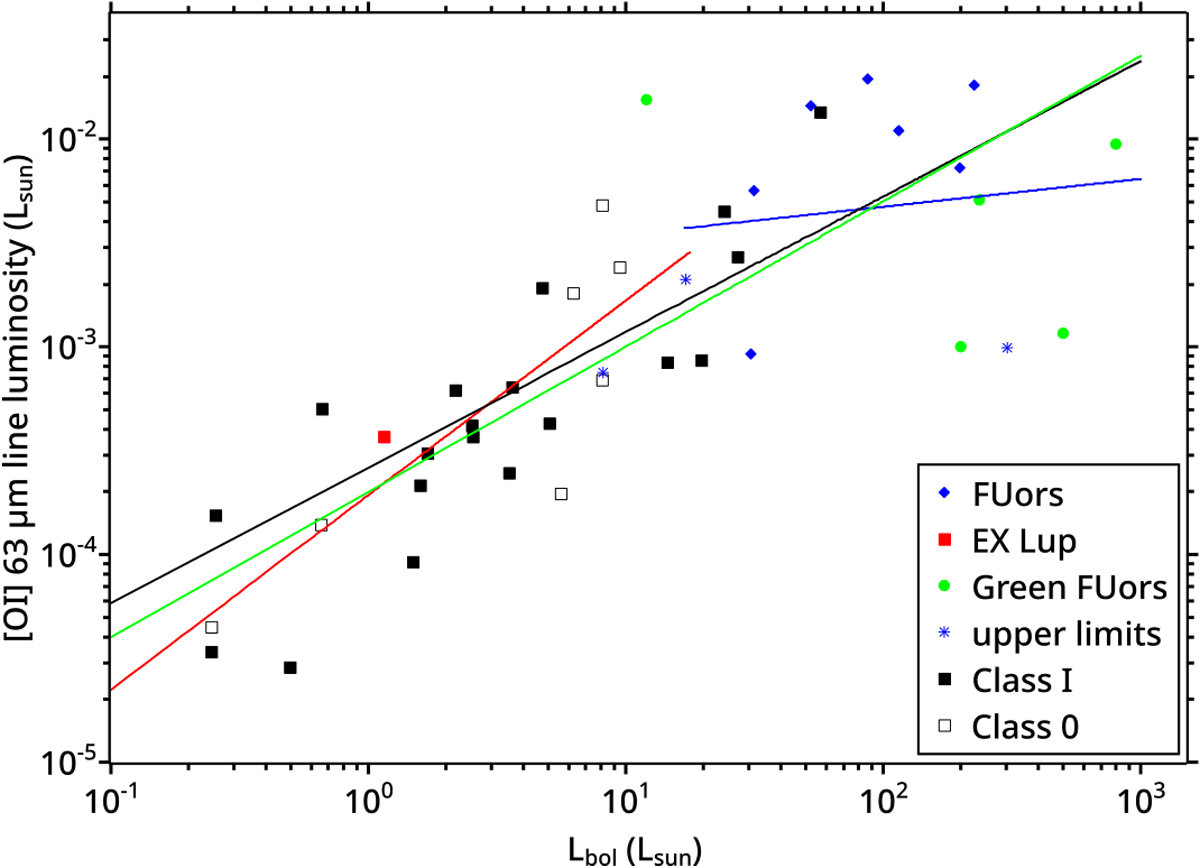
[O I] luminosity at 63 μm as a function of the bolometric luminosity of the object. The black curve represents the best-fit result of the data with f(x) = 0.65 ⋅ x − 3.6 and χ2 = 7.8. We show two additional lines which partially fit the data (in red) with f(x) = 0.94 ⋅ x −3.7, Lbol <17 L⊙, and χ2 = 3.5, and (in blue)with f(x) = 0.13 ⋅ x − 2.6, Lbol >17 L⊙, and χ2 = 3.2. We also show the best fit of Green et al. (2013a) with f(x) = 0.70 ⋅ x − 3.7 (in green). The data points that are indicated as upper limits (3σ) and EX Lup are not used to create the fits.
Current usage metrics show cumulative count of Article Views (full-text article views including HTML views, PDF and ePub downloads, according to the available data) and Abstracts Views on Vision4Press platform.
Data correspond to usage on the plateform after 2015. The current usage metrics is available 48-96 hours after online publication and is updated daily on week days.
Initial download of the metrics may take a while.