Fig. 5
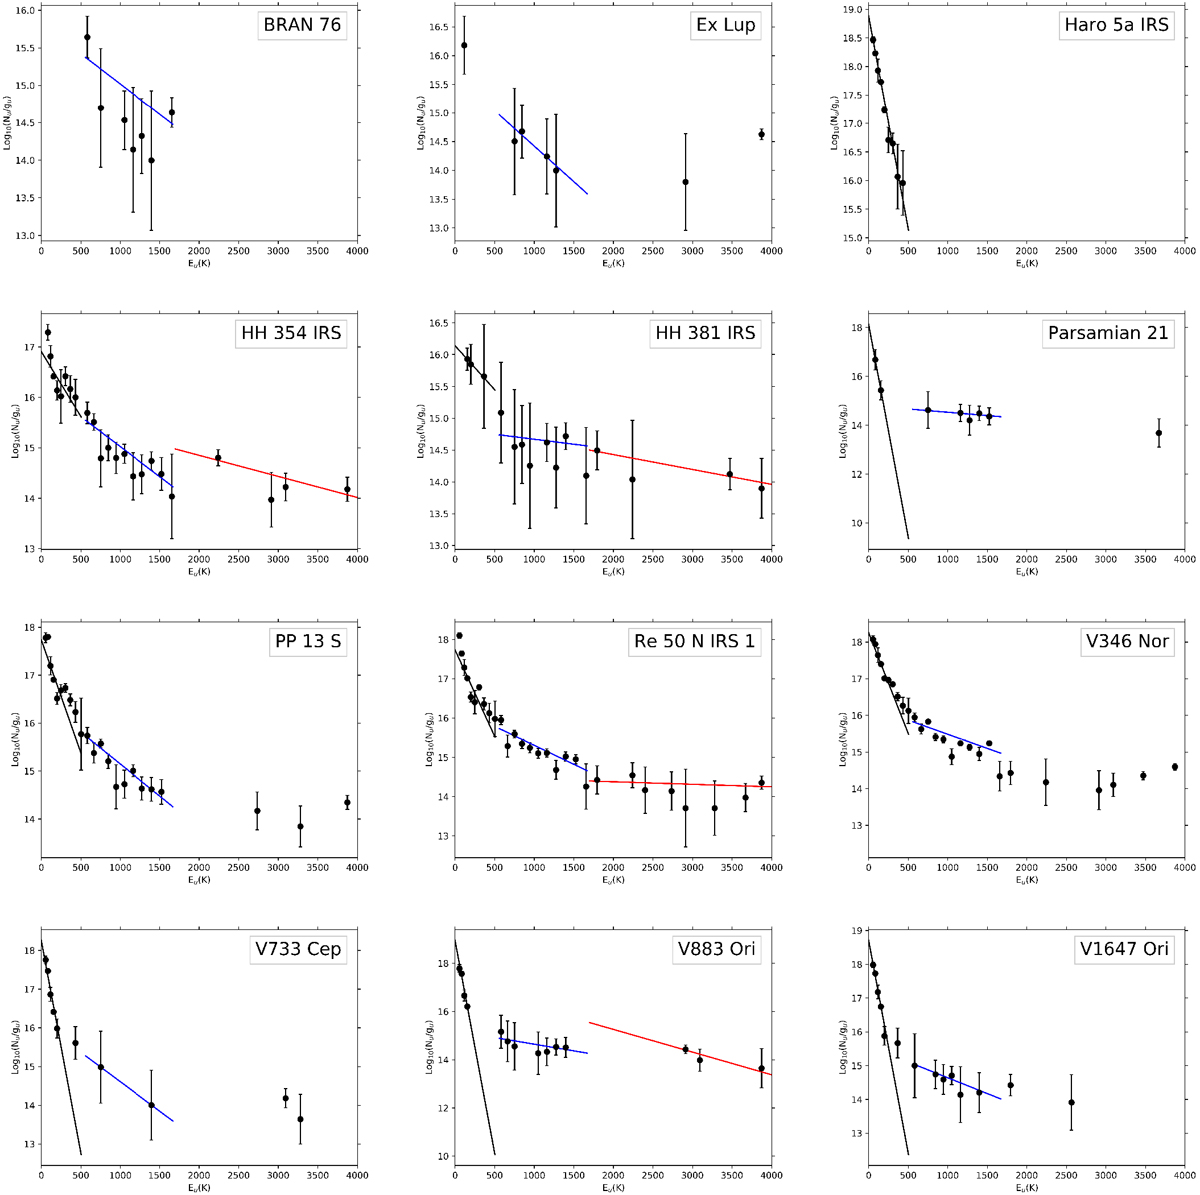
CO rotational diagrams of all objects. We plot the decadic logarithm of the column densities Nu divided by the statistical weight gu, as function of the upper level energy of the transition Eu in Kelvin. SPIRE data are fitted with black, PACS data are fitted with blue and red. As the plots contain a logarithmic scale, the errors are actually not symmetric, but we use it here as an approximation.
Current usage metrics show cumulative count of Article Views (full-text article views including HTML views, PDF and ePub downloads, according to the available data) and Abstracts Views on Vision4Press platform.
Data correspond to usage on the plateform after 2015. The current usage metrics is available 48-96 hours after online publication and is updated daily on week days.
Initial download of the metrics may take a while.