Fig. 4
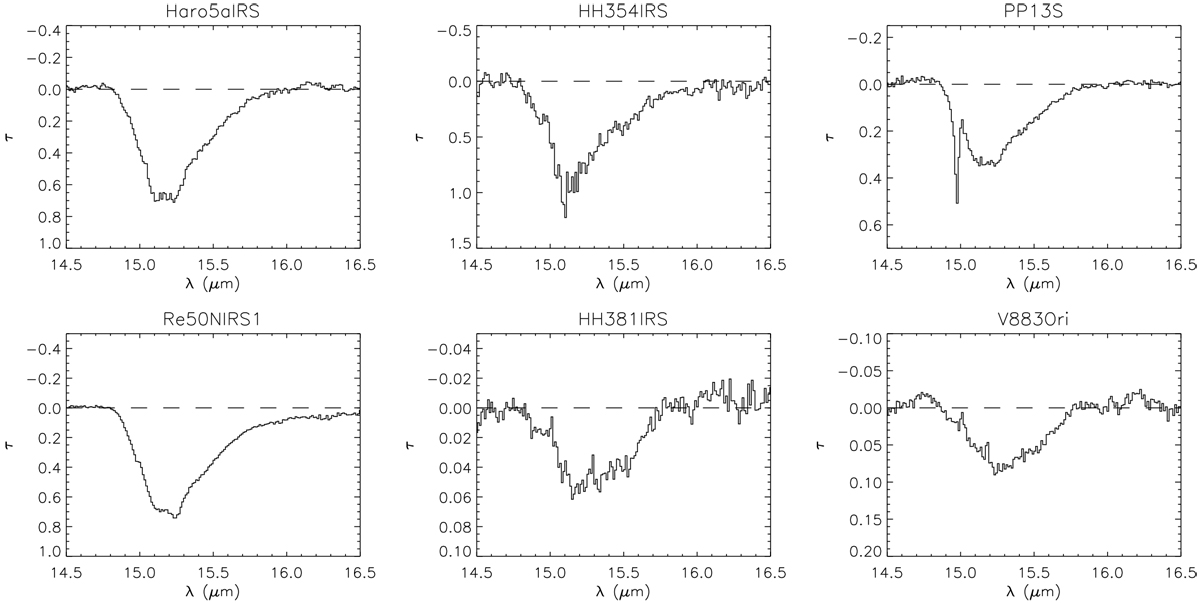
Zoom-in of the Spitzer spectra for targets with CO2 ice absorption. Absorption optical depths τ near 15 μm were derived from F = F0e−τ, where F is the observed flux density, and F0 is the continuum derived from a continuum fit, obtained with a polynomial of degree N = 3 (red curve; HH 381 IRS, V883 Ori, BRAN 76, and V733 Cep needed N = 2) to fit the ranges 13.5–14.7 and 18.2–19.5 μm (except for HH 381 IRS and V883 Ori for which 13.5–14.7 and 16.0–17.0 μm were used). In addition, in some cases, a Gaussian function centered on 608 cm−1 (16.45 μm) and of FWHM = 73 cm−1 was added tofit the 16.5-18.2 μm range to account for absorption due to silicates. This method is similar to that used by Pontoppidan et al. (2008). Interestingly, we detect gas absorption by CO2 at 15.0 μm, but only in PP13 S.
Current usage metrics show cumulative count of Article Views (full-text article views including HTML views, PDF and ePub downloads, according to the available data) and Abstracts Views on Vision4Press platform.
Data correspond to usage on the plateform after 2015. The current usage metrics is available 48-96 hours after online publication and is updated daily on week days.
Initial download of the metrics may take a while.