Fig. A.1
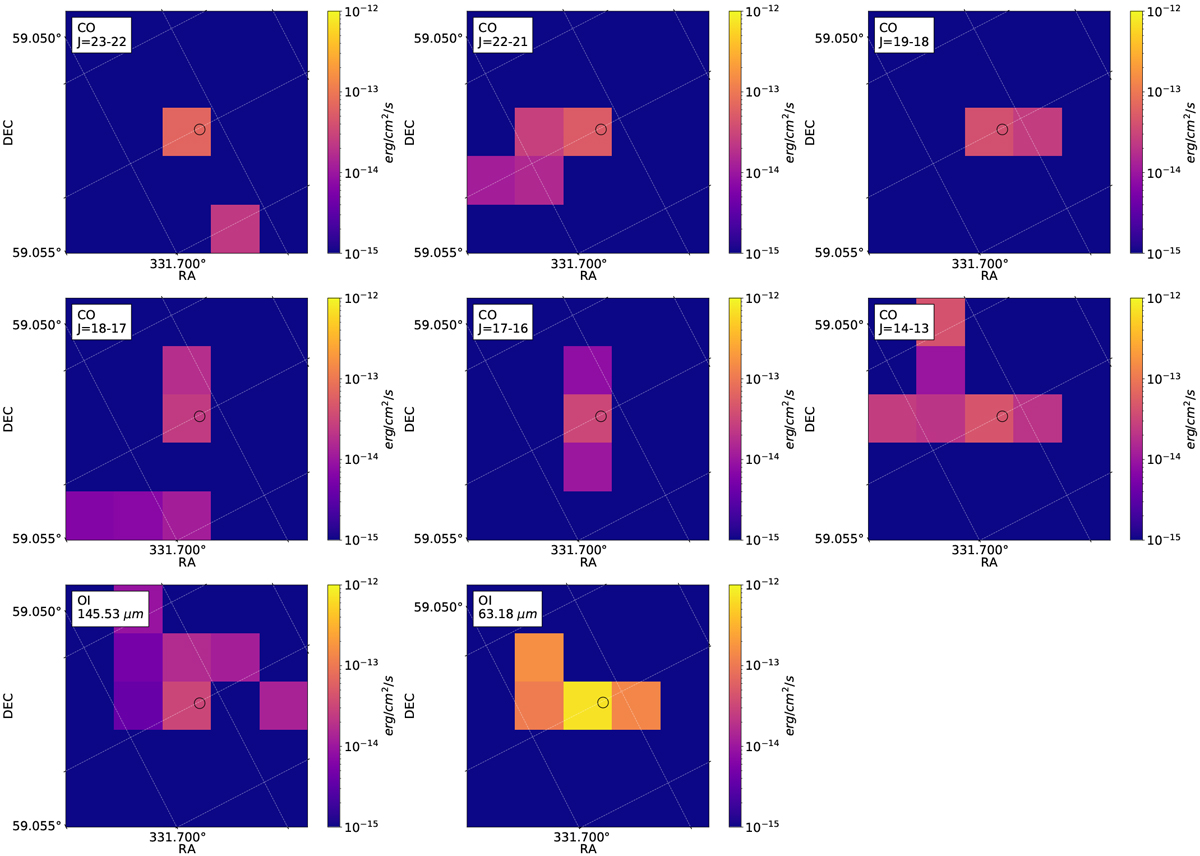
Line maps of PACS with visible lines for HH354 IRS. The maps show a specific bandwidth around emission lines of molecularor atomic transitions in the spectra coming from the integral field spectroscopy from PACS. The bandwidth is defined for each source by a fitting routine. A threshold cuts off noise below a specific value. For molecular lines, the species is mentioned in the upper left corner of the plot, together with the energy transition for CO and its isotopolog and the wavelength for other molecules. For the atomic lines, next to the isotope we give the frequency of the transition. The circle in each of the plots represents the coordinates of the optical FUor/EXor.
Current usage metrics show cumulative count of Article Views (full-text article views including HTML views, PDF and ePub downloads, according to the available data) and Abstracts Views on Vision4Press platform.
Data correspond to usage on the plateform after 2015. The current usage metrics is available 48-96 hours after online publication and is updated daily on week days.
Initial download of the metrics may take a while.