Fig. 1
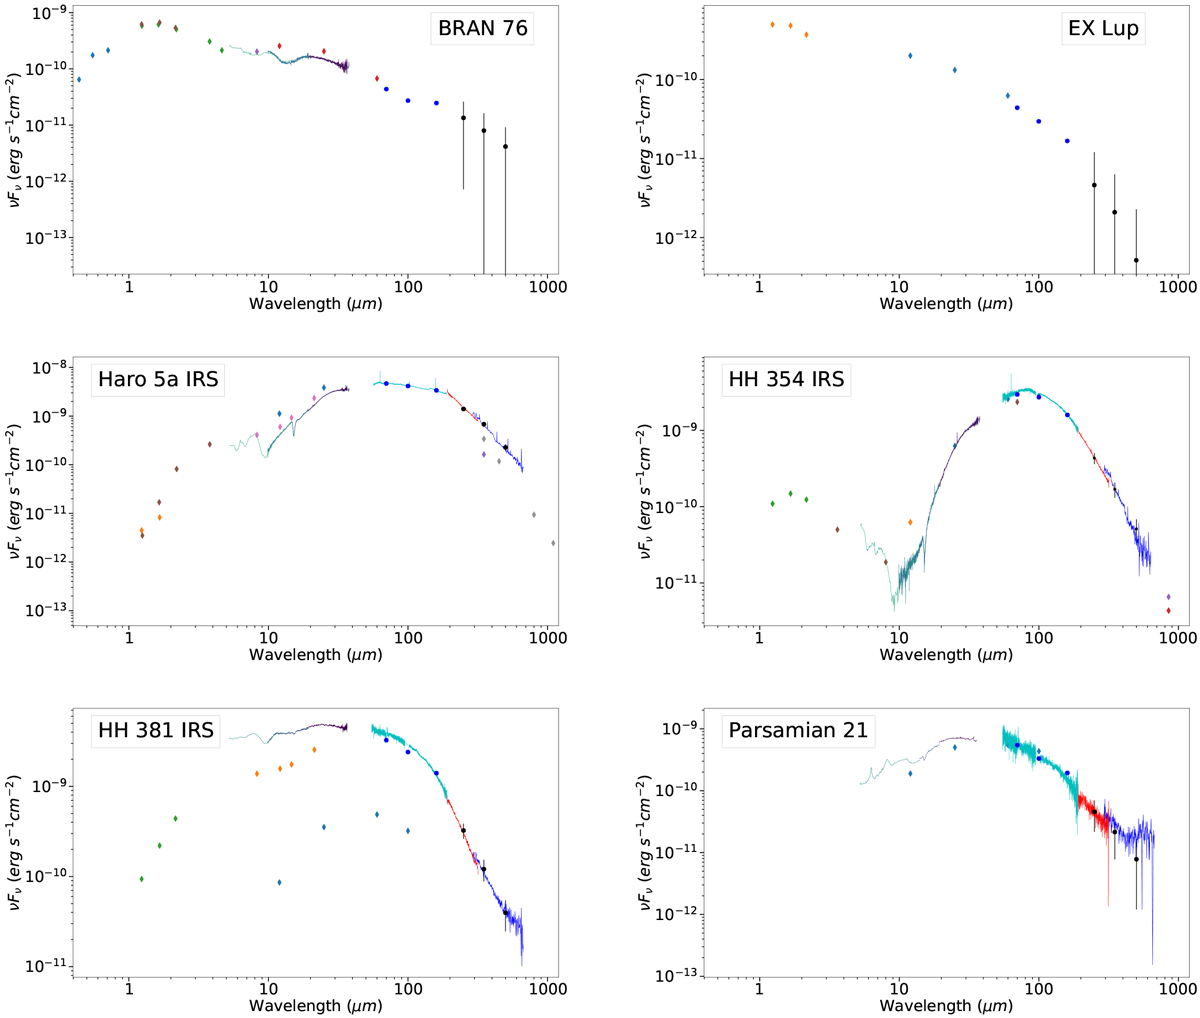
Spectral energy distributions of the objects BRAN 76 (top left), EX Lupi (top right), Haro 5a IRS (middle left), HH 354 IRS (middle right), HH 381 IRS (bottom left), and Parsamian 21 (bottom right) including PACS spectra and photometry data (turquoise line + blue dots at 70, 100, and 160 μm), SPIRE high-resolution spectra (dark blue and red lines), and SPIRE photometry (black dots at 250, 350, and 500 μm) combined with spectra from Spitzer (lines in other colors below 50 μm) and photometry from other sources (diamonds; color-coded by source).
Current usage metrics show cumulative count of Article Views (full-text article views including HTML views, PDF and ePub downloads, according to the available data) and Abstracts Views on Vision4Press platform.
Data correspond to usage on the plateform after 2015. The current usage metrics is available 48-96 hours after online publication and is updated daily on week days.
Initial download of the metrics may take a while.