Free Access
Fig. 7.
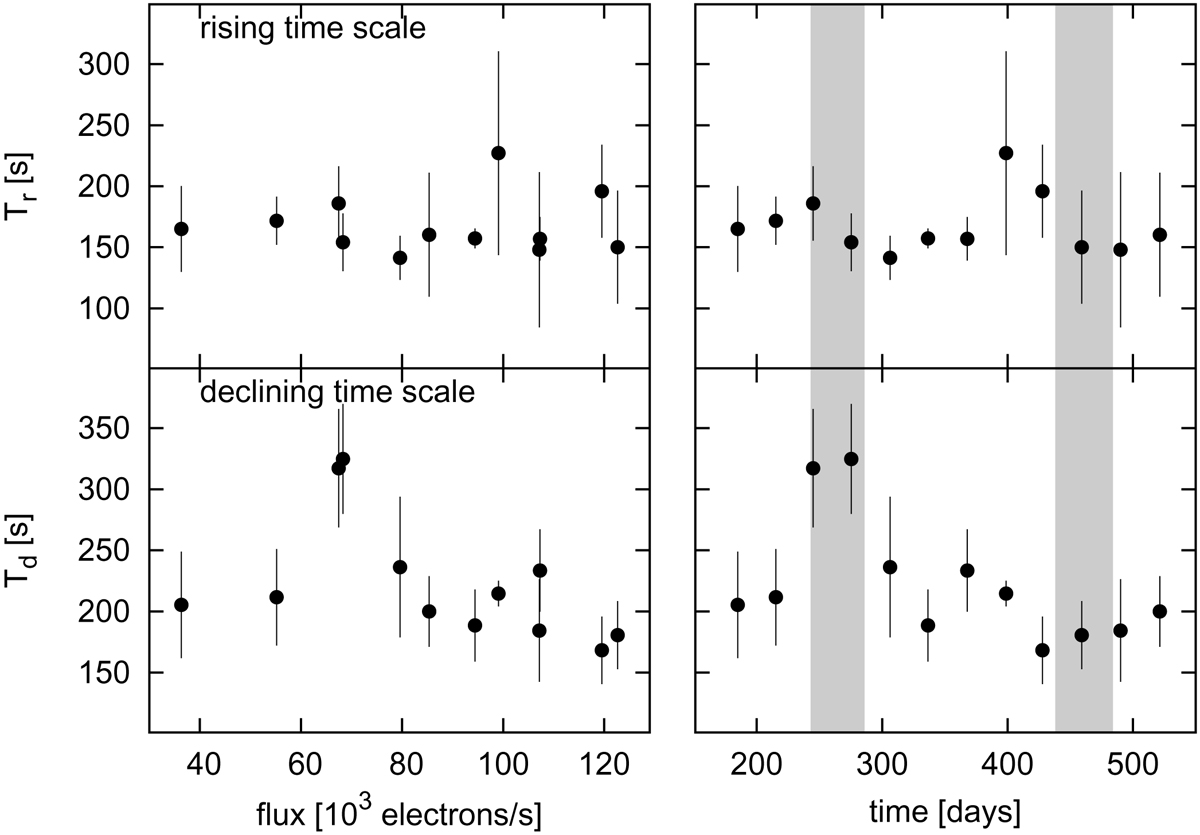
Timescales of the central spike evolution as functions of the averaged flux (left panels) and light curve segment time (right panels). The shaded areas in the right panels correspond to the shaded areas in Fig. 1.
Current usage metrics show cumulative count of Article Views (full-text article views including HTML views, PDF and ePub downloads, according to the available data) and Abstracts Views on Vision4Press platform.
Data correspond to usage on the plateform after 2015. The current usage metrics is available 48-96 hours after online publication and is updated daily on week days.
Initial download of the metrics may take a while.