Free Access
Fig. 6.
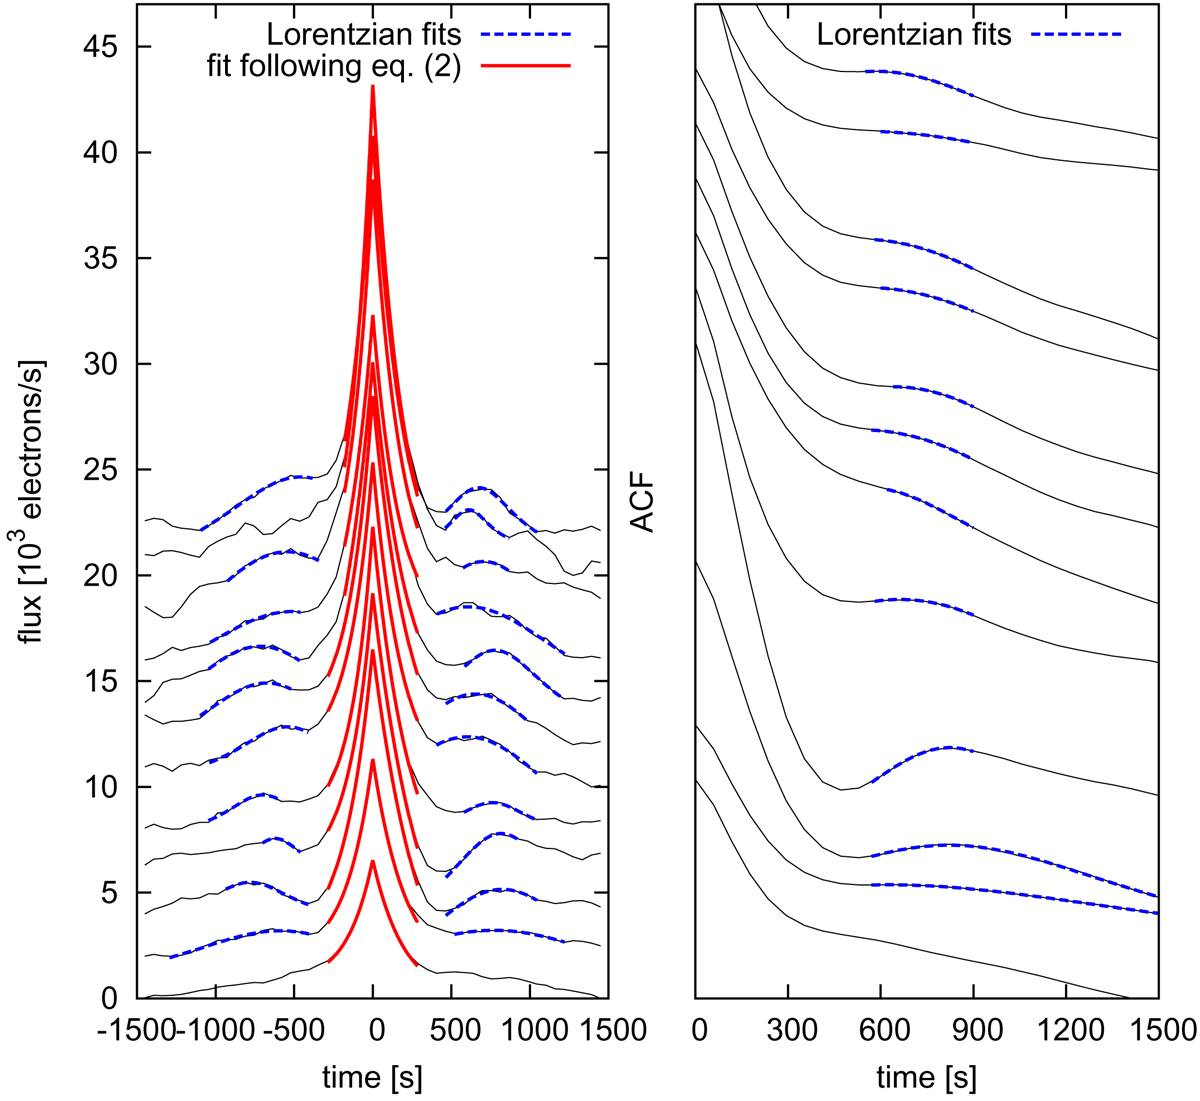
Left panel: individual shot profiles (Npts = 50) from light curve subsamples with individual component fits. The time evolution is from bottom to top. The lowest profile has the original flux values, while every next profile is offset by 2000 el. s−1 vertically. Right panel: same as left panel but derived using ACF.
Current usage metrics show cumulative count of Article Views (full-text article views including HTML views, PDF and ePub downloads, according to the available data) and Abstracts Views on Vision4Press platform.
Data correspond to usage on the plateform after 2015. The current usage metrics is available 48-96 hours after online publication and is updated daily on week days.
Initial download of the metrics may take a while.