Free Access
Fig. 11.
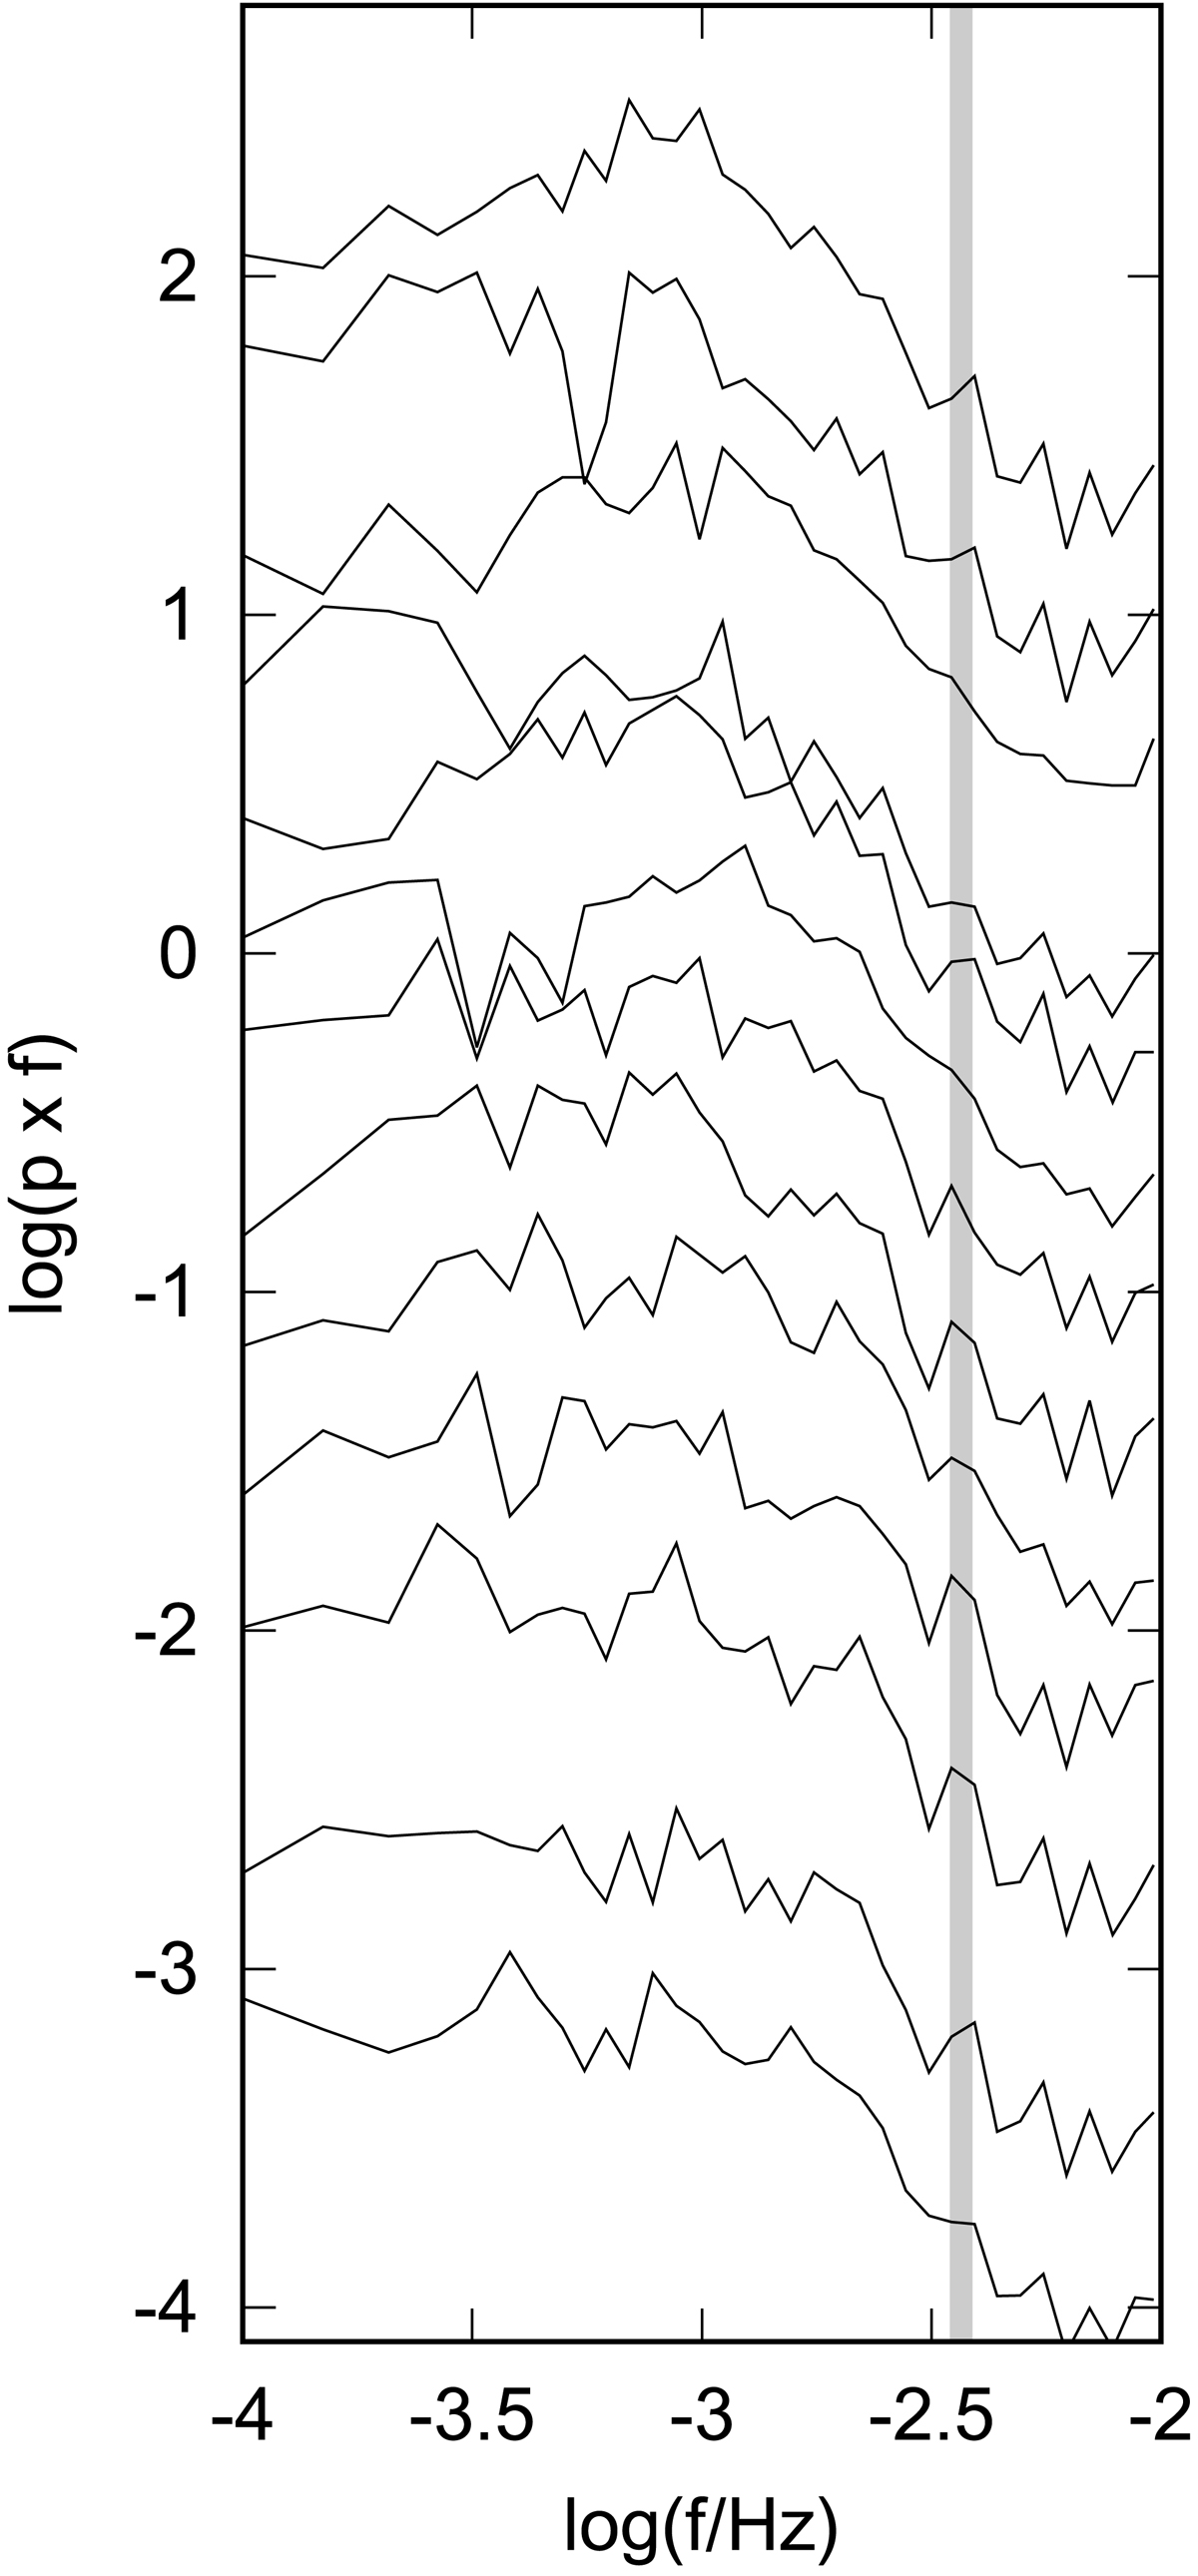
PDSs calculated from Kepler light curve. The whole light curve in Fig. 1 is divided into equal 25 day segments and every PDS represents the corresponding segment; the first PDS is at the bottom. The vertical shaded area shows the frequencies of expected power excess between log(f/Hz) = −2.46 and −2.41.
Current usage metrics show cumulative count of Article Views (full-text article views including HTML views, PDF and ePub downloads, according to the available data) and Abstracts Views on Vision4Press platform.
Data correspond to usage on the plateform after 2015. The current usage metrics is available 48-96 hours after online publication and is updated daily on week days.
Initial download of the metrics may take a while.