Fig. 10.
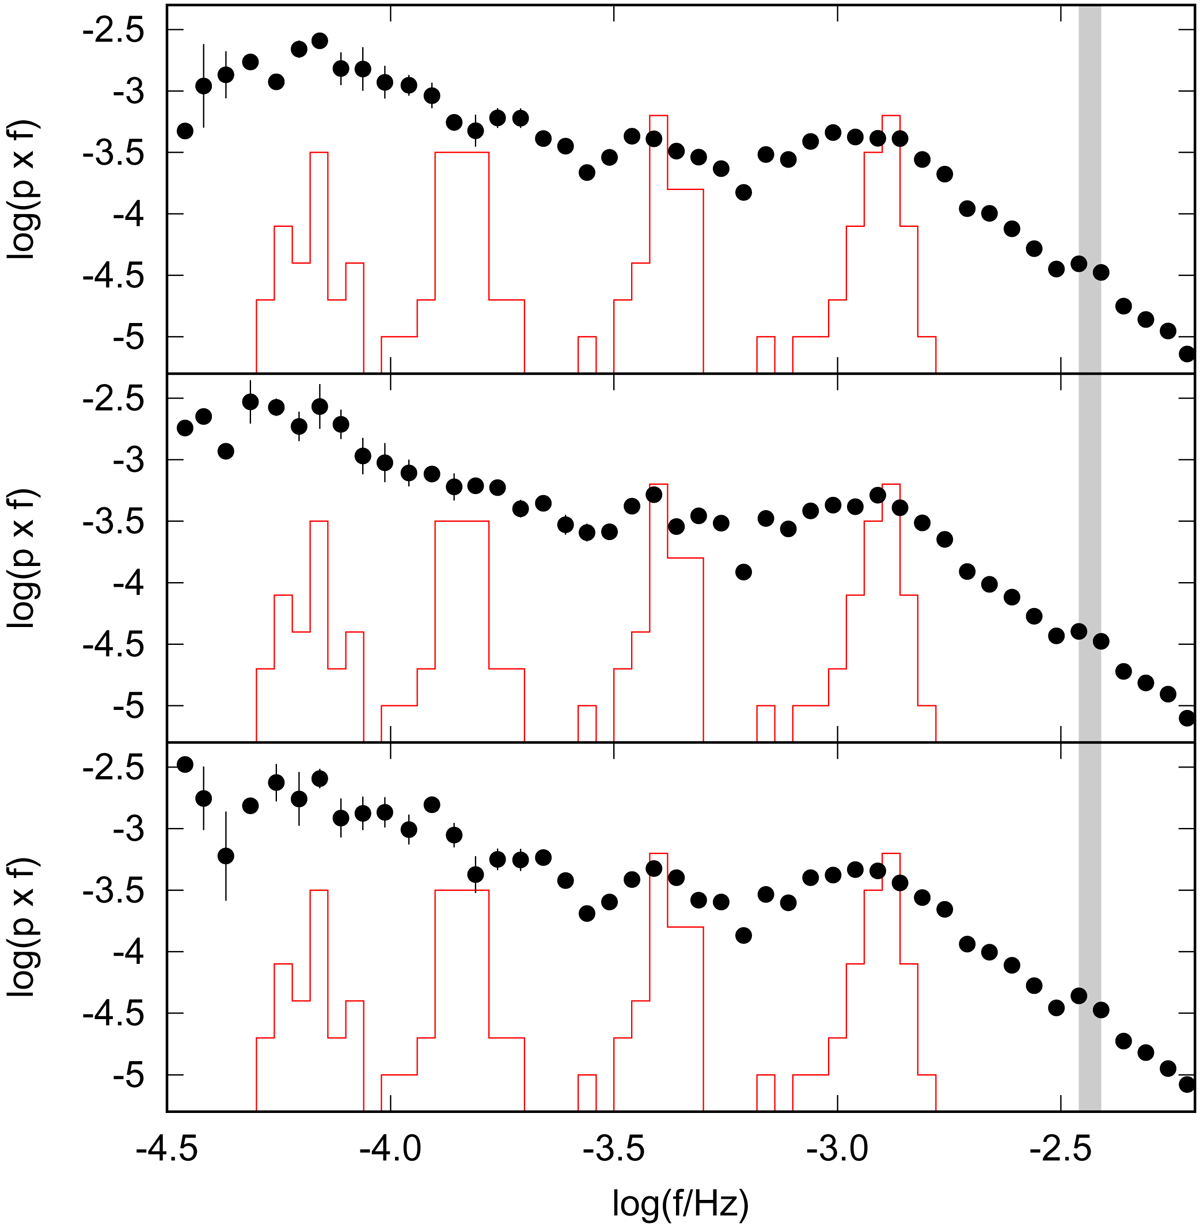
PDSs calculated from simulated light curve subsamples. The points are averaged means with the standard error of the mean as vertical lines. The vertical shaded area shows the frequencies of two points with a small power deviation at log(f/Hz) = −2.46 and −2.41 representing a potential high frequency PDS component. The solid red lines represent the histogram of frequencies detected in Kepler data from Table 1 of Scaringi et al. (2012b).
Current usage metrics show cumulative count of Article Views (full-text article views including HTML views, PDF and ePub downloads, according to the available data) and Abstracts Views on Vision4Press platform.
Data correspond to usage on the plateform after 2015. The current usage metrics is available 48-96 hours after online publication and is updated daily on week days.
Initial download of the metrics may take a while.