Free Access
Fig. 1.
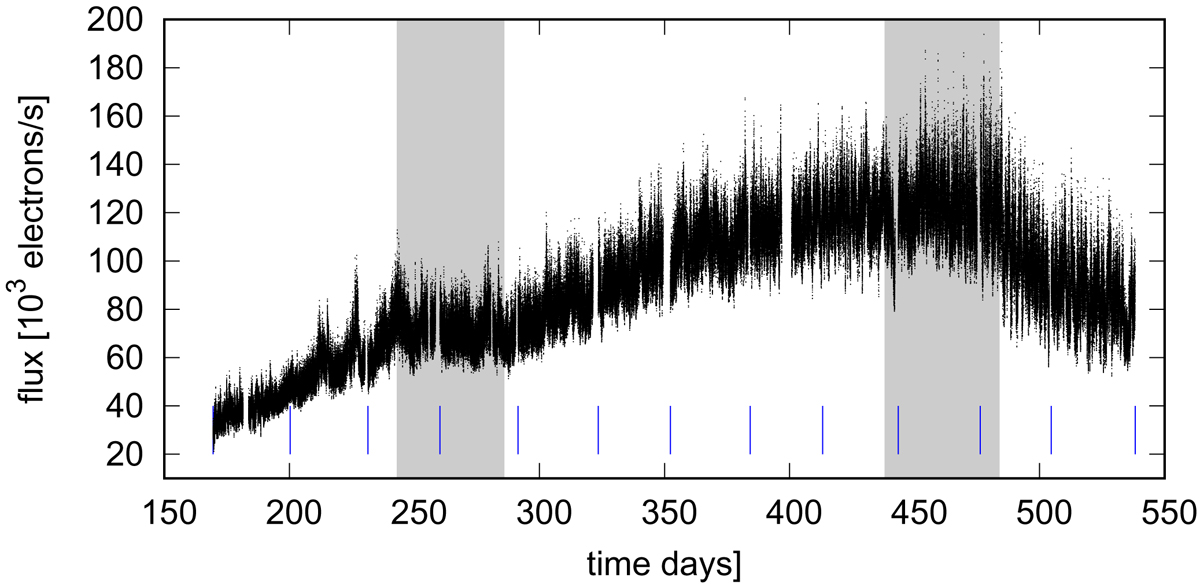
Analysed Kepler light curve of MV Lyr with shaded regions roughly showing two intervals with constant flux. The vertical blue lines divide the light curve into 12 subsamples used for the shot profile evolution calculation in Sect. 4.3.
Current usage metrics show cumulative count of Article Views (full-text article views including HTML views, PDF and ePub downloads, according to the available data) and Abstracts Views on Vision4Press platform.
Data correspond to usage on the plateform after 2015. The current usage metrics is available 48-96 hours after online publication and is updated daily on week days.
Initial download of the metrics may take a while.