Fig. 8.
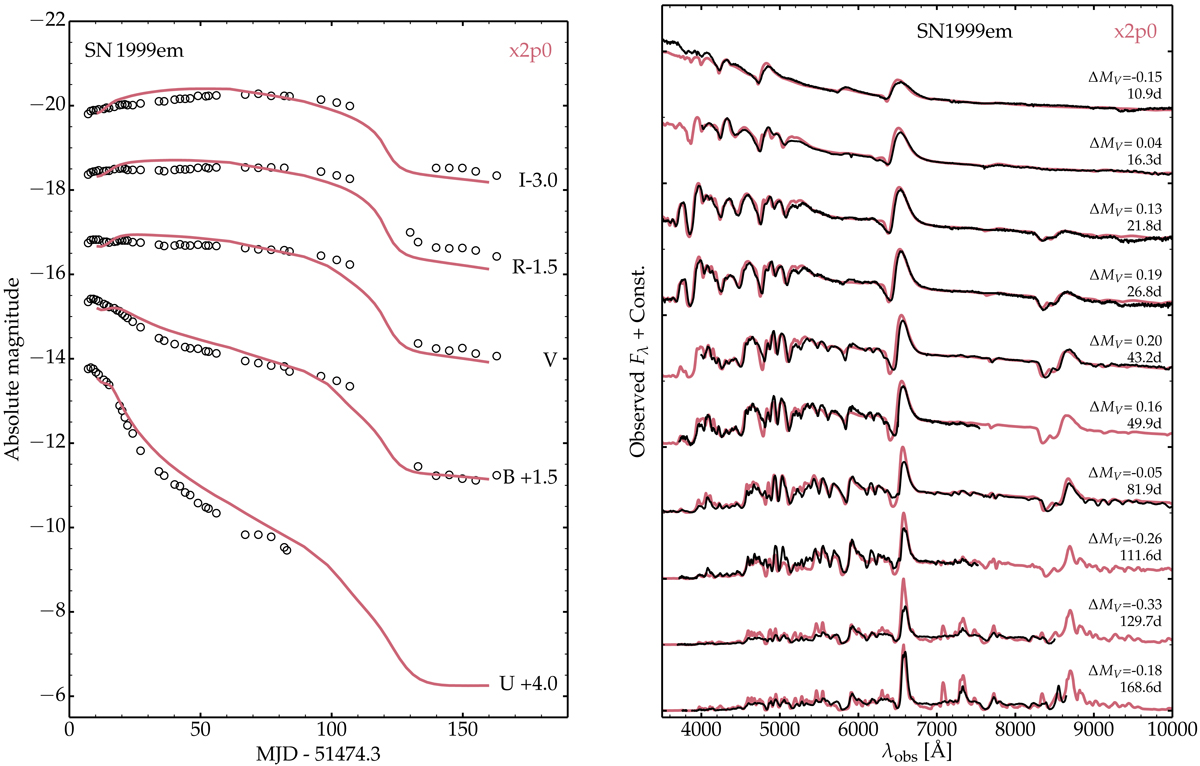
Comparison of multi-band light curves (left) and multi-epoch spectra (right) for SN 1999em and model x2p0. The time origin is the inferred time of explosion. For the spectral comparison, the model is redshifted and reddened, and the label ΔMV gives the V-band magnitude offset at each epoch. The spectra are normalized to each other and shifted for better visibility.
Current usage metrics show cumulative count of Article Views (full-text article views including HTML views, PDF and ePub downloads, according to the available data) and Abstracts Views on Vision4Press platform.
Data correspond to usage on the plateform after 2015. The current usage metrics is available 48-96 hours after online publication and is updated daily on week days.
Initial download of the metrics may take a while.