Free Access
Fig. 5.
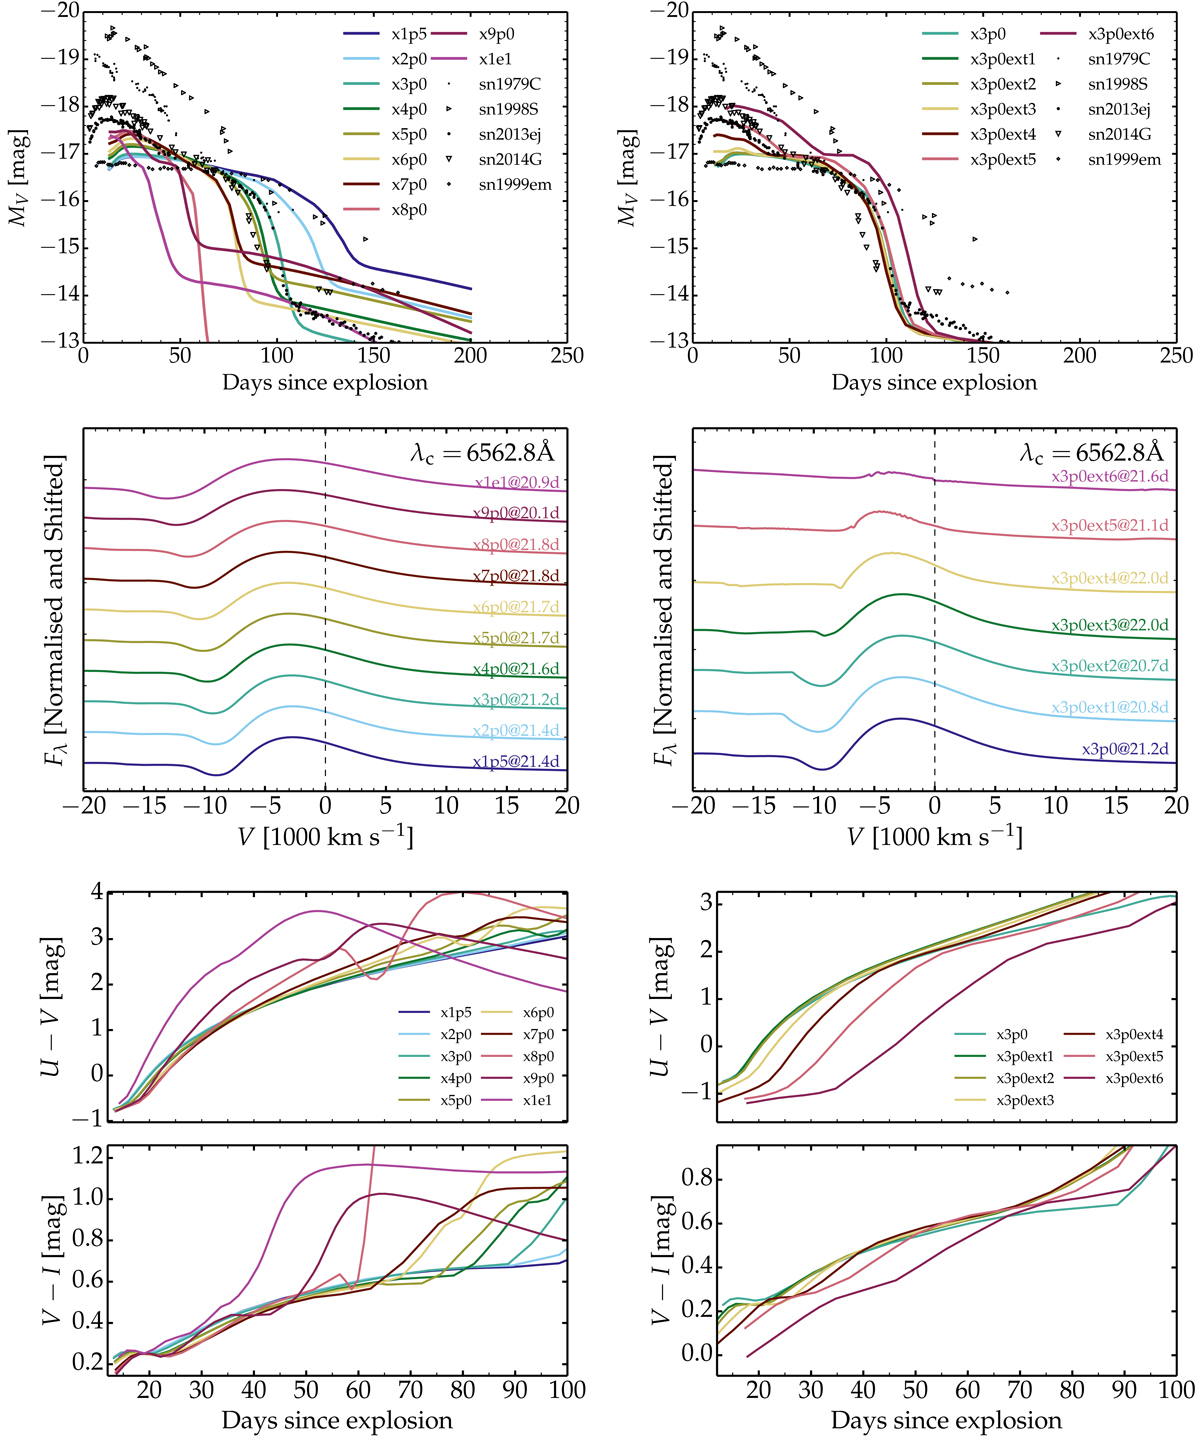
Left: illustration of the absolute V-band light curves (top), the spectral region centered on Hα at about 20 d after explosion (middle), and the U − V and V − I color curves (bottom) for the mdot simulations performed with CMFGEN. Right: same as left, but now for the ext model set (see Sect. 5 for discussion).
Current usage metrics show cumulative count of Article Views (full-text article views including HTML views, PDF and ePub downloads, according to the available data) and Abstracts Views on Vision4Press platform.
Data correspond to usage on the plateform after 2015. The current usage metrics is available 48-96 hours after online publication and is updated daily on week days.
Initial download of the metrics may take a while.