Free Access
Fig. A.1.
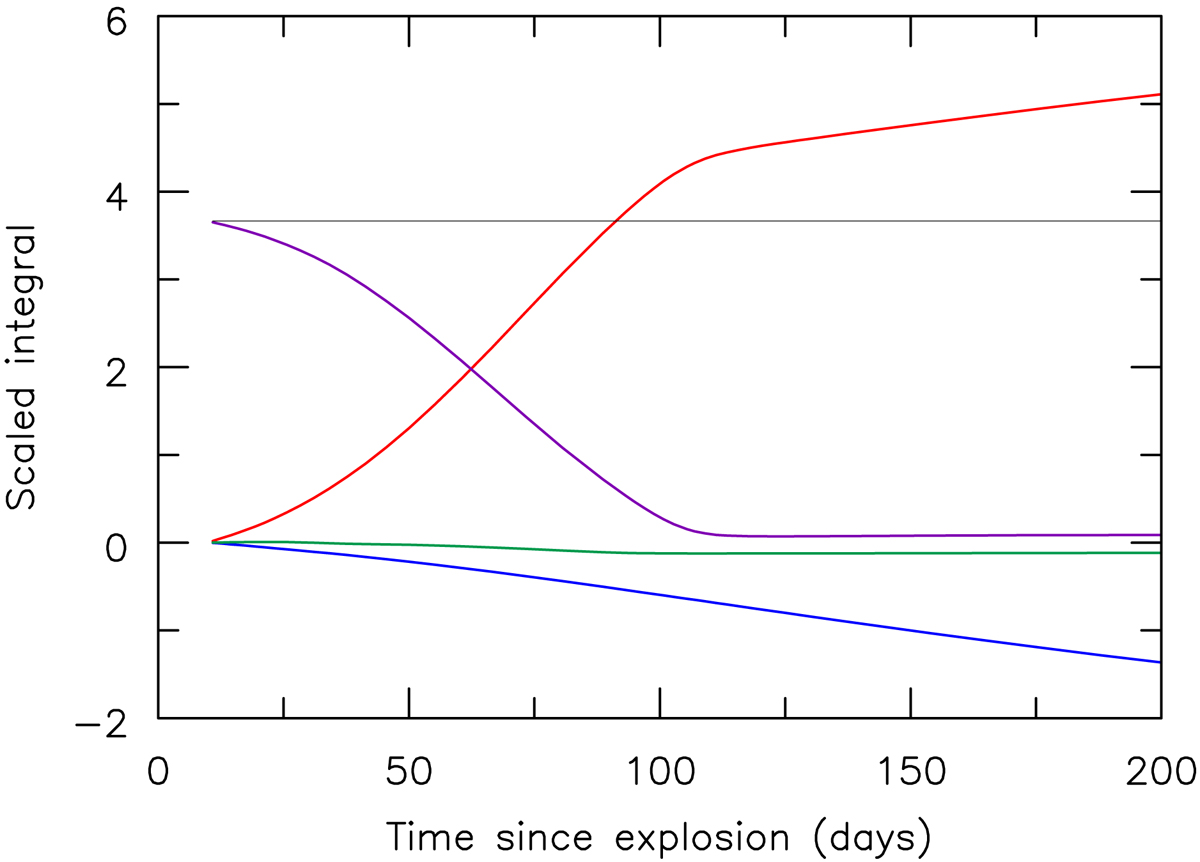
Comparison of various terms in Eq. (A.2) for model x3p0. The red curve shows ![]() , the blue curve is
, the blue curve is ![]() , the green curve is
, the green curve is ![]() , and the purple curve is tE(t). The sum of these 4 curves gives the initial energy t0E(t0) (shown in black) to better than 1.5% at all epochs.
, and the purple curve is tE(t). The sum of these 4 curves gives the initial energy t0E(t0) (shown in black) to better than 1.5% at all epochs.
Current usage metrics show cumulative count of Article Views (full-text article views including HTML views, PDF and ePub downloads, according to the available data) and Abstracts Views on Vision4Press platform.
Data correspond to usage on the plateform after 2015. The current usage metrics is available 48-96 hours after online publication and is updated daily on week days.
Initial download of the metrics may take a while.