Fig. 6.
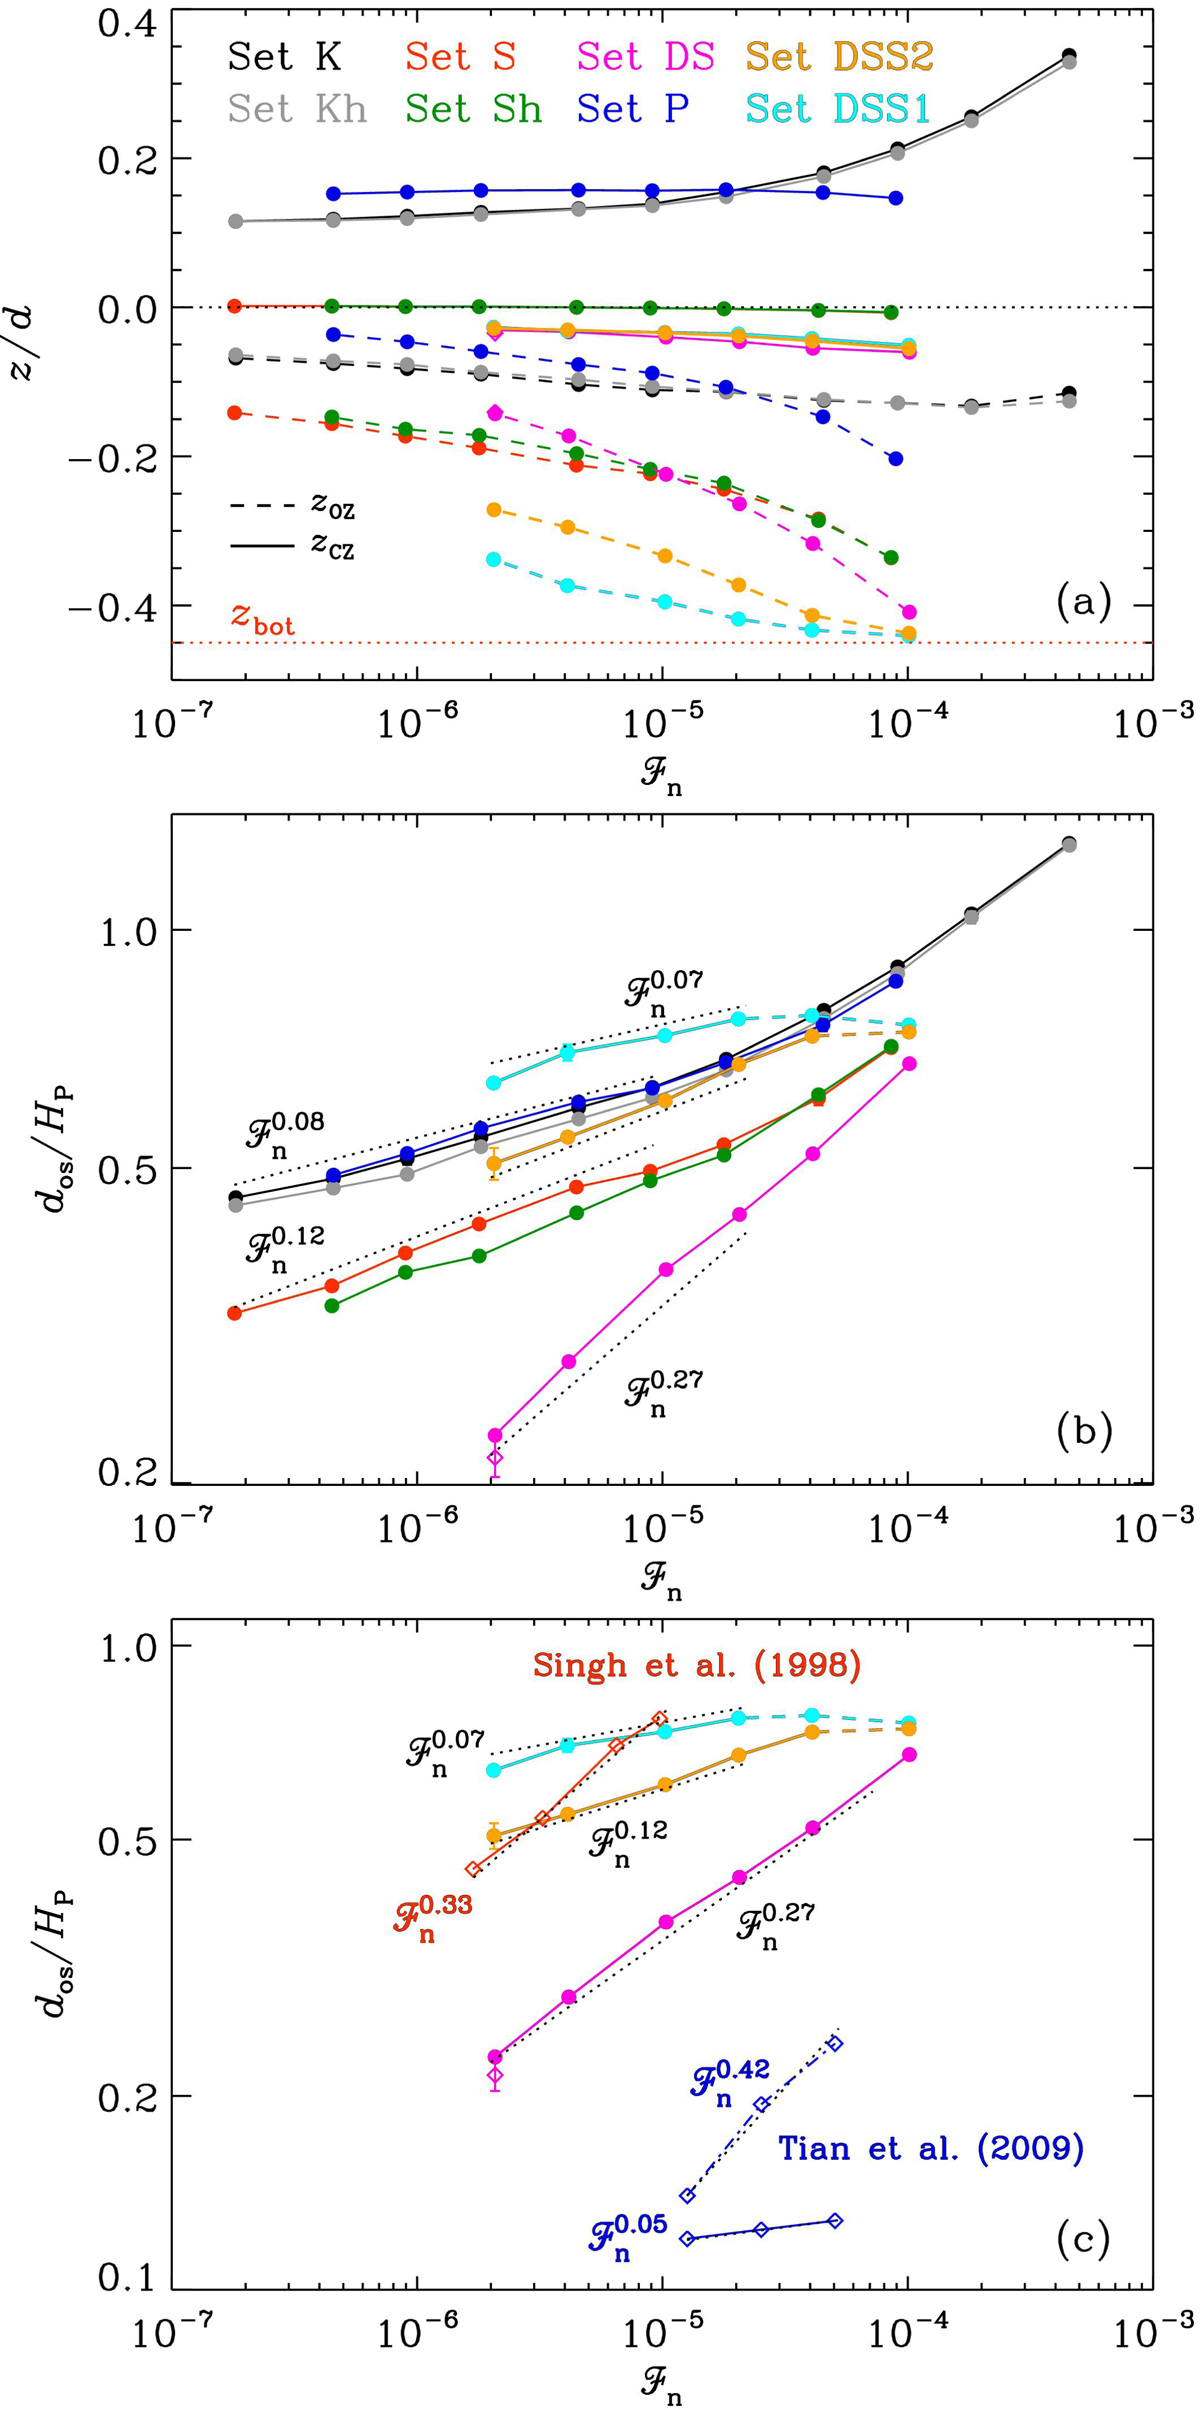
Panel a: vertical (z) coordinates of the bottom of the CZ (zCZ, solid lines) and OZ (zOZ, dashed). The dotted red line indicates the bottom of the domain. Panel b: overshooting depth dos normalised by the pressure scale height Hp as a function of ℱn for Sets K (black), Kh (grey), P (blue), S (red), Sh (green), DS (purple), DSS1 (cyan), and DSS2 (orange). The purple diamond denotes Run DS5h. The dotted lines show approximate power laws from fits to simulation data; see Table 5. Panel c: comparison of Sets DS, DSS1, and DSS2 with the studies of Singh et al. (1998) (red) and Tian et al. (2009) (blue).
Current usage metrics show cumulative count of Article Views (full-text article views including HTML views, PDF and ePub downloads, according to the available data) and Abstracts Views on Vision4Press platform.
Data correspond to usage on the plateform after 2015. The current usage metrics is available 48-96 hours after online publication and is updated daily on week days.
Initial download of the metrics may take a while.