Fig. 5.
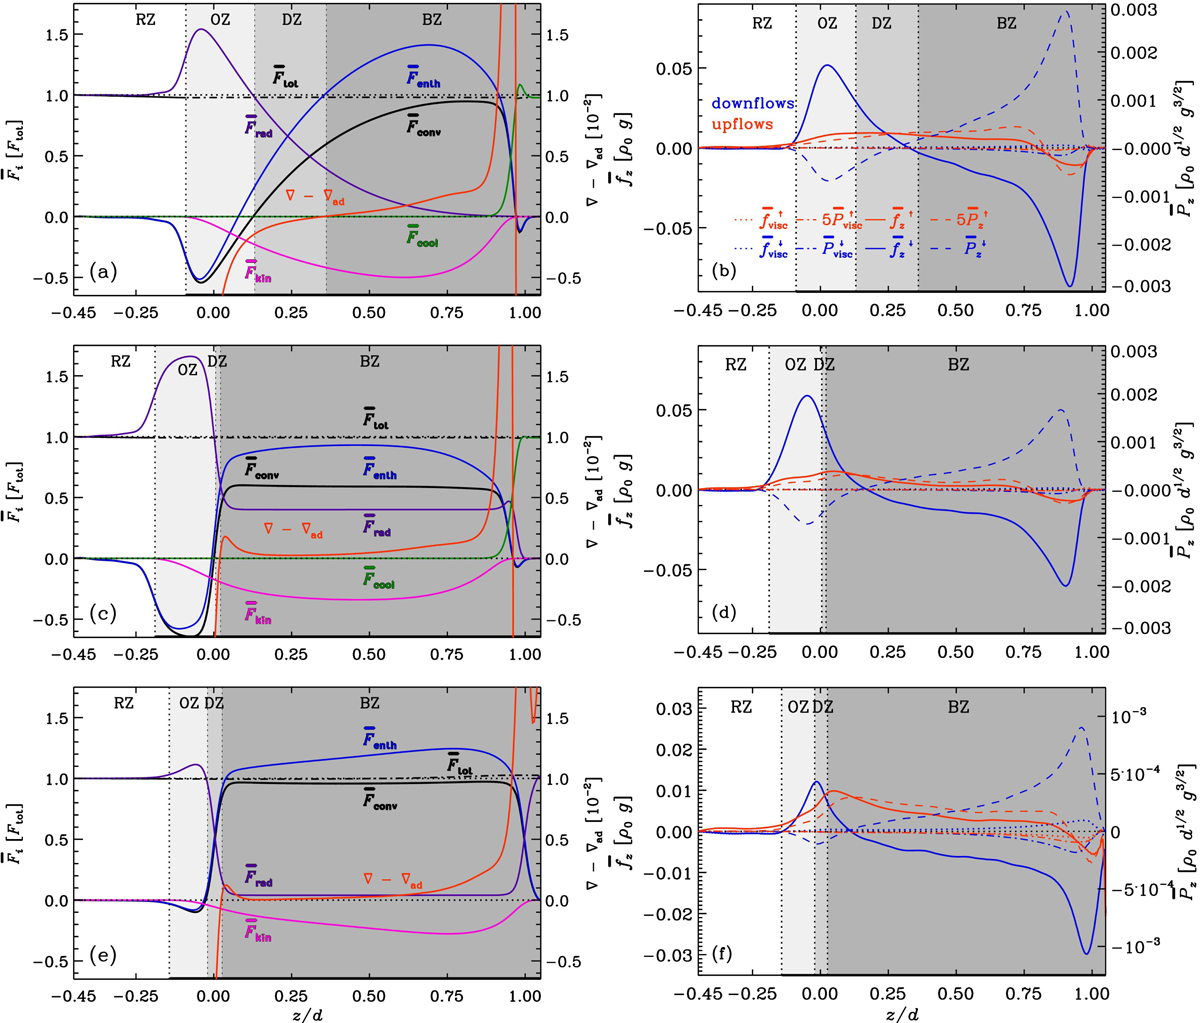
Panels a, c, and e: total (black dash-dotted lines), convective (black), enthalpy (blue), kinetic energy (light purple), radiative (dark purple), and cooling (green) fluxes and the superadiabatic temperature gradient (red) from Runs K4, S4, and DS5, respectively. Panels b, d, and f: total averaged vertical forces (solid lines) and the power of the forces (dashed) on the upflows (red) and downflows (blue) from the same runs. The dotted lines in these panels show the corresponding viscous force and its power. The shaded areas indicate the BZ (darkest), DZ, and OZ (lightest) and the thick black line at the horizontal axis denotes the MZ.
Current usage metrics show cumulative count of Article Views (full-text article views including HTML views, PDF and ePub downloads, according to the available data) and Abstracts Views on Vision4Press platform.
Data correspond to usage on the plateform after 2015. The current usage metrics is available 48-96 hours after online publication and is updated daily on week days.
Initial download of the metrics may take a while.