Fig. 13.
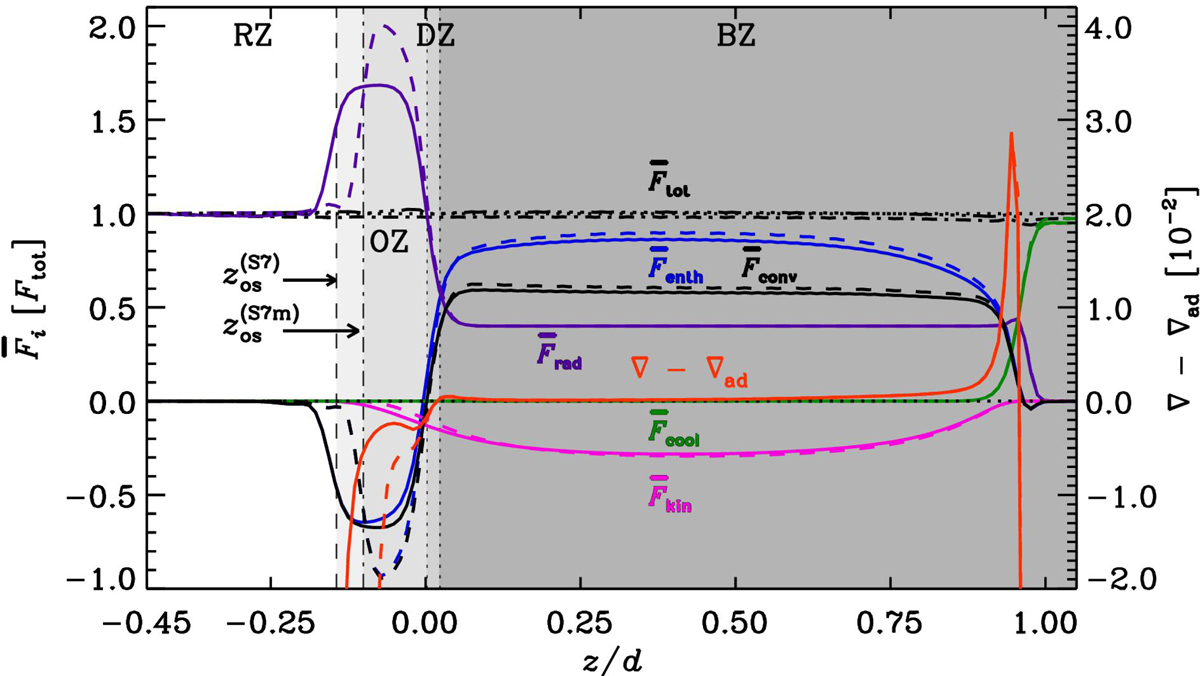
Time-averaged total (black dash-dotted), convective (black), enthalpy (blue), radiative (dark purple), kinetic energy (light purple), and cooling (green) fluxes from Runs S7 (solid) and S7m (dashed). The vertical dotted lines indicate the bottoms of the buoyancy (BZ) and Deardorff zones (DZ). The bottom of the overshoot zone (OZ) for Run S7 (S7m) is denoted by the dashed (dot-dashed) vertical line.
Current usage metrics show cumulative count of Article Views (full-text article views including HTML views, PDF and ePub downloads, according to the available data) and Abstracts Views on Vision4Press platform.
Data correspond to usage on the plateform after 2015. The current usage metrics is available 48-96 hours after online publication and is updated daily on week days.
Initial download of the metrics may take a while.