Free Access
Fig. 10.
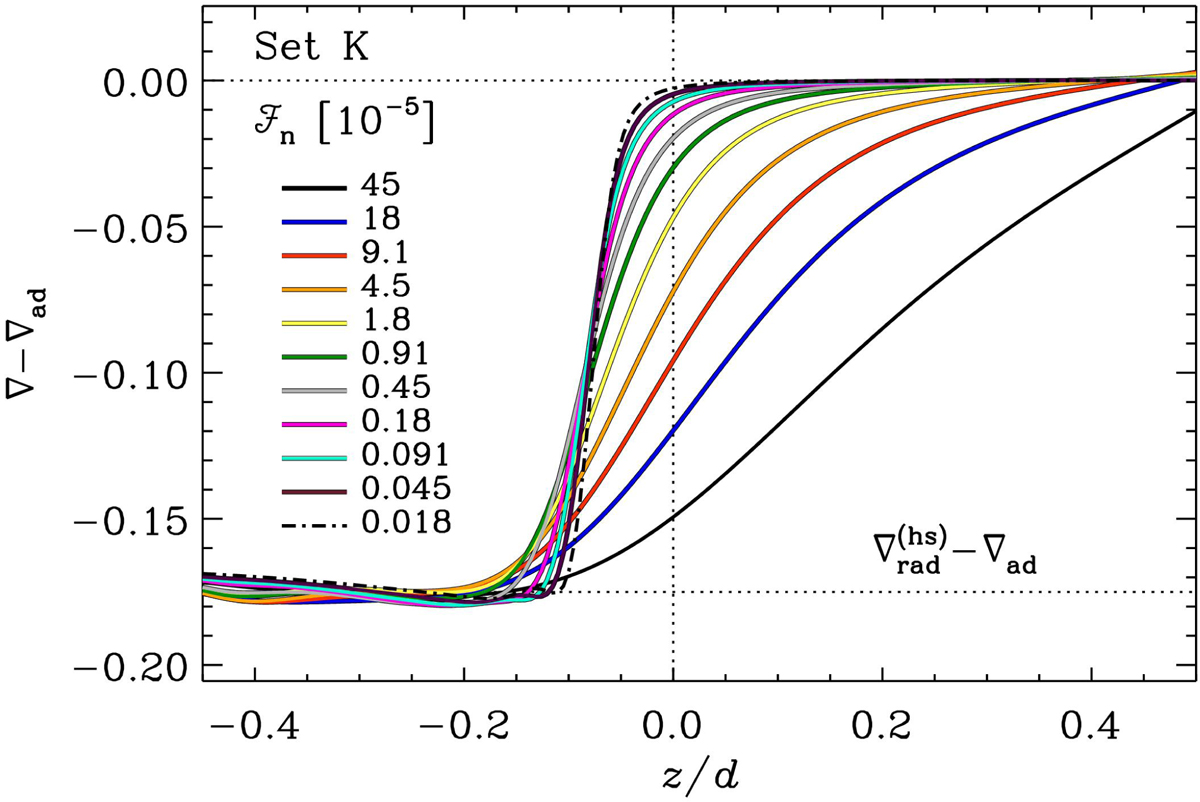
Superadiabatic temperature gradient at the bottom of the CZ in Set K. The normalised energy flux in each run is indicated in the legend. The vertical dotted line indicates the position of the bottom of the CZ in the initial state, and ![]() corresponds to the hydrostatic solution in the case where ∇T = const.
corresponds to the hydrostatic solution in the case where ∇T = const.
Current usage metrics show cumulative count of Article Views (full-text article views including HTML views, PDF and ePub downloads, according to the available data) and Abstracts Views on Vision4Press platform.
Data correspond to usage on the plateform after 2015. The current usage metrics is available 48-96 hours after online publication and is updated daily on week days.
Initial download of the metrics may take a while.