Fig. 7
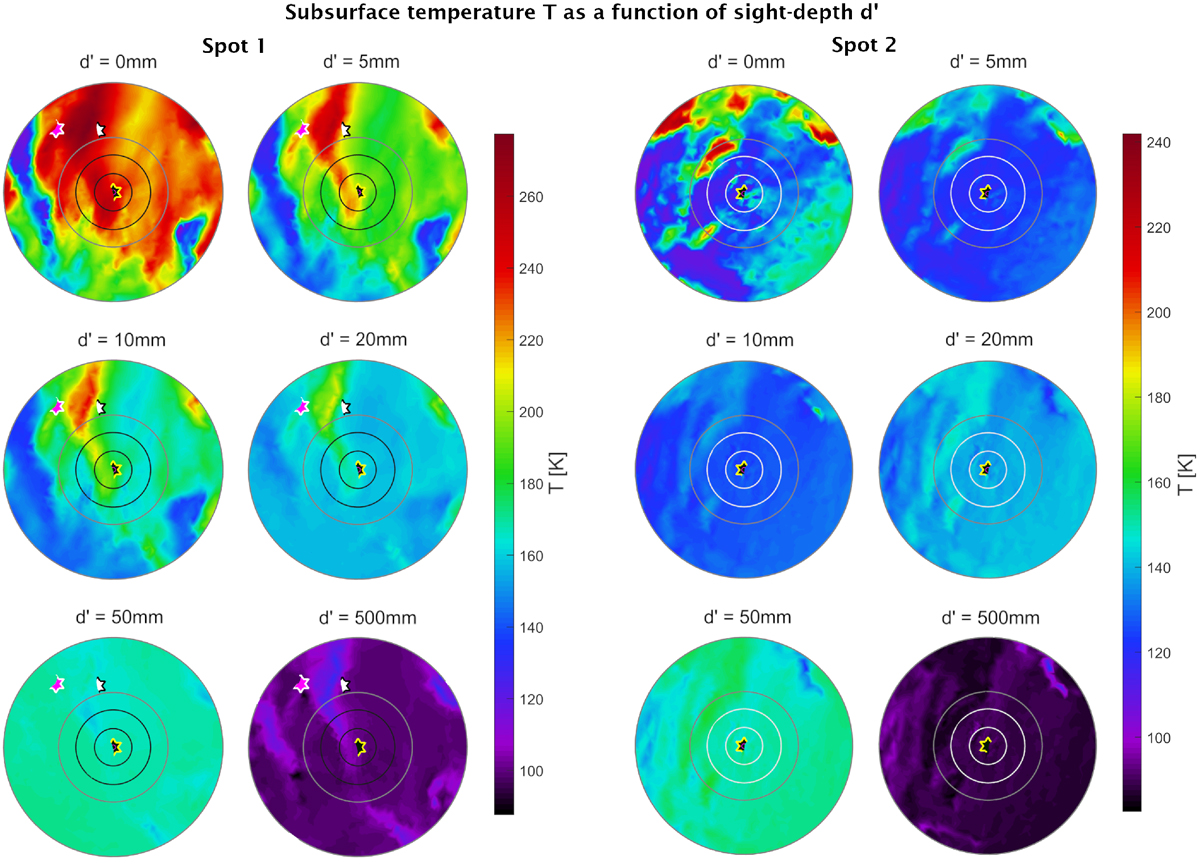
Subsurface temperature distribution at different depths d′ (along the MIRO line of sight) at the respective MIRO observation time. Stars show the same selected surface points as in Fig. 2, and circles refer to 1 FWHM and 2 FWHM beam widths of the SubMM and MM channel. The horizontal axes of these plots are aligned with those of the respective spots in Fig. 2.
Current usage metrics show cumulative count of Article Views (full-text article views including HTML views, PDF and ePub downloads, according to the available data) and Abstracts Views on Vision4Press platform.
Data correspond to usage on the plateform after 2015. The current usage metrics is available 48-96 hours after online publication and is updated daily on week days.
Initial download of the metrics may take a while.