Fig. 2
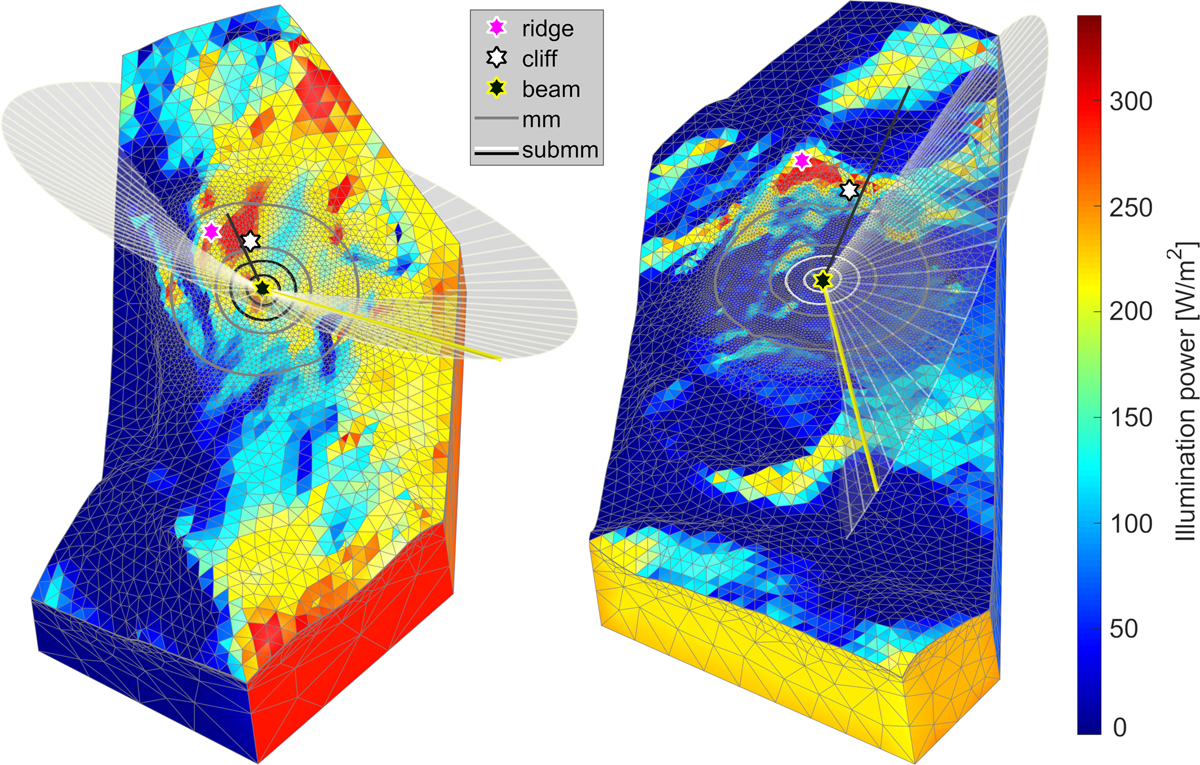
Regions containing Spot 1 (left) and Spot 2 (right) in the COMSOL mesh as used for numerical simulations. The surface is colored according to solar irradiance at the respective MIRO observation time. The gray cones are the rays from the Sun to the spot centers during one cometary rotation; the yellow straight line refers to MIRO observation time. The black straight line points toward the spacecraft. Spot 1 is about 1 km long, and Spot 2 about 3 km (vertical extension in figure).
Current usage metrics show cumulative count of Article Views (full-text article views including HTML views, PDF and ePub downloads, according to the available data) and Abstracts Views on Vision4Press platform.
Data correspond to usage on the plateform after 2015. The current usage metrics is available 48-96 hours after online publication and is updated daily on week days.
Initial download of the metrics may take a while.