Free Access
Fig. 13
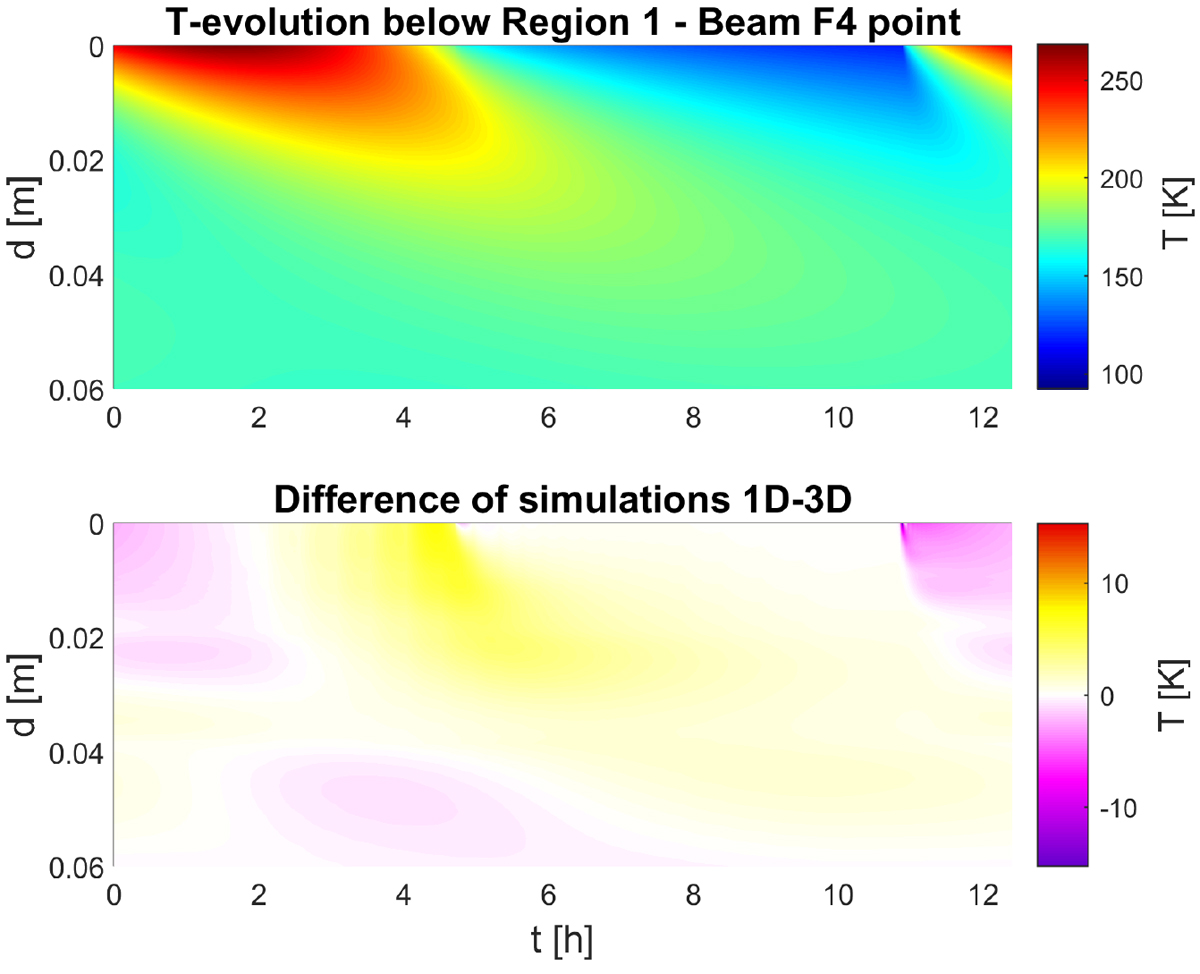
Evolution of the temperature profile T3D obtained by 3D simulations (top) and the corresponding difference T1D − T3D between 1D and 3D simulations (bottom). Abscissas and ordinates represent time after MIRO measurement and depth normal to surface, respectively.
Current usage metrics show cumulative count of Article Views (full-text article views including HTML views, PDF and ePub downloads, according to the available data) and Abstracts Views on Vision4Press platform.
Data correspond to usage on the plateform after 2015. The current usage metrics is available 48-96 hours after online publication and is updated daily on week days.
Initial download of the metrics may take a while.