Fig. 9.
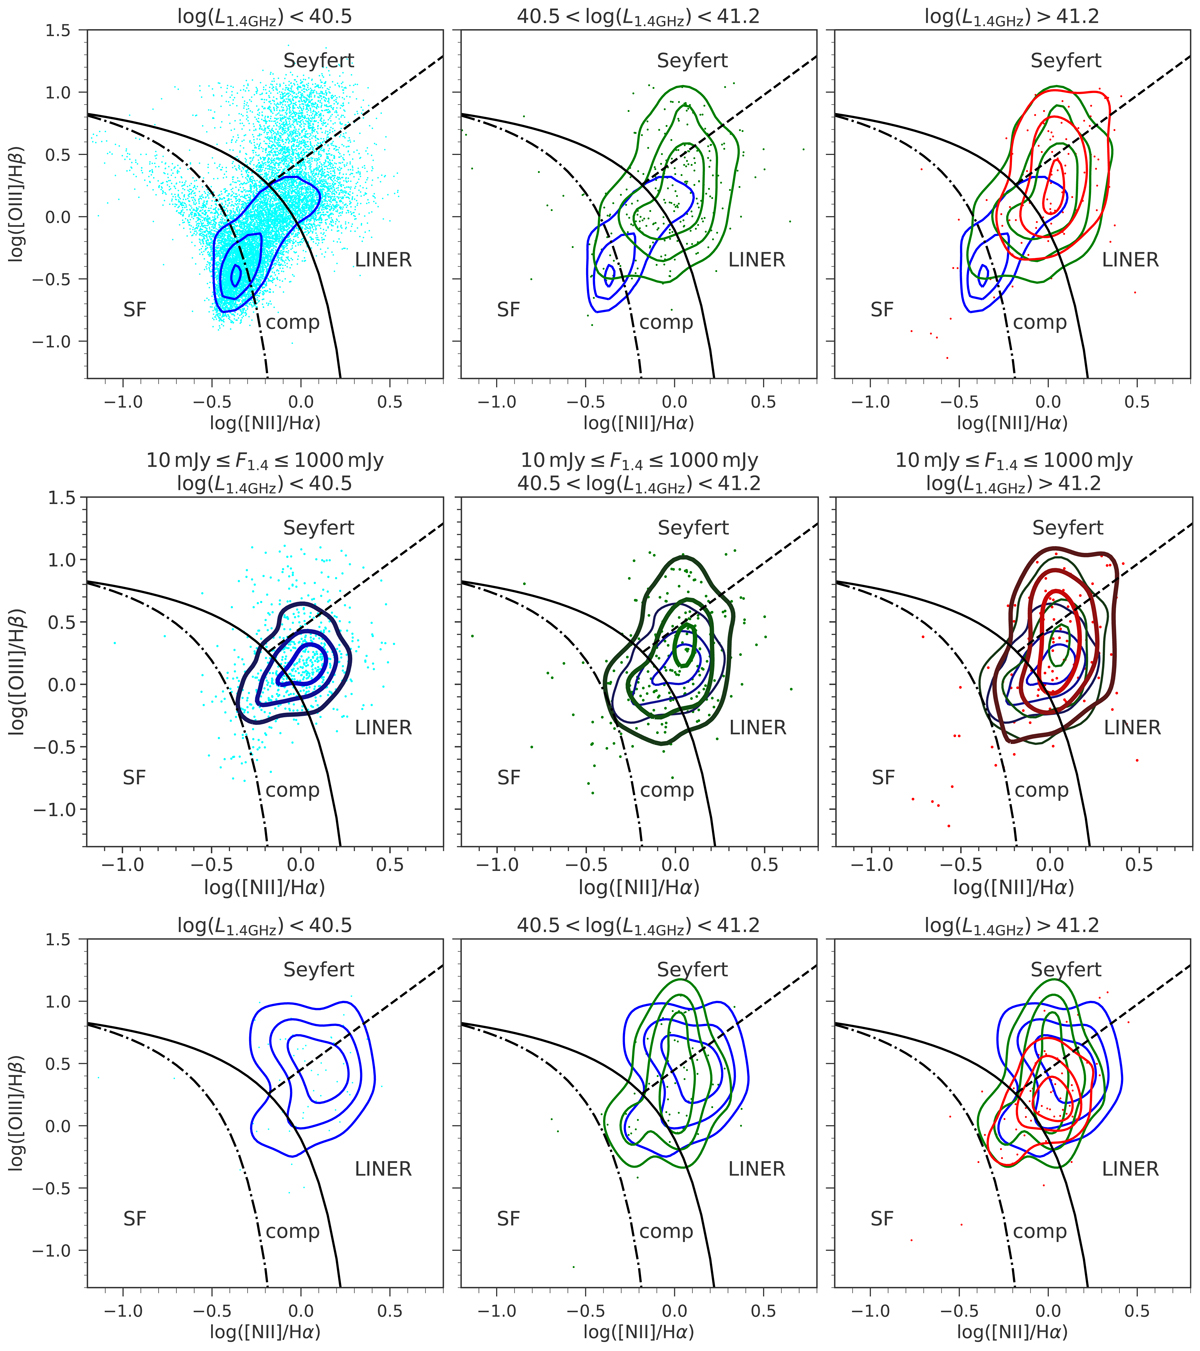
Distribution of the radio luminosity at 1.4 GHz, L1.4 GHz, in optical diagnostic diagrams. Top row: distribution of the radio luminosity L1.4 GHz for the parent sample. The contours correspond to the distribution of the sources for the luminosity bins, log(L1.4 GHz) < 40.5, 40.5 < log(L1.4 GHz) < 41.2, and log(L1.4 GHz) > 41.2, with the increasing radio luminosity from left to right. Middle row: distribution of the radio luminosity L1.4 GHz as in the top row but for a flux-limited subsample of the parent sample, 10 mJy ≤ 1.4 GHz ≤ 1000 mJy. The luminosity bins are the same as in the top row. Bottom row: distribution of the radio luminosity L1.4 GHz for the Effelsberg sample only (low + high flux sources). The luminosity bins are the same as in the top row.
Current usage metrics show cumulative count of Article Views (full-text article views including HTML views, PDF and ePub downloads, according to the available data) and Abstracts Views on Vision4Press platform.
Data correspond to usage on the plateform after 2015. The current usage metrics is available 48-96 hours after online publication and is updated daily on week days.
Initial download of the metrics may take a while.