Fig. 7.
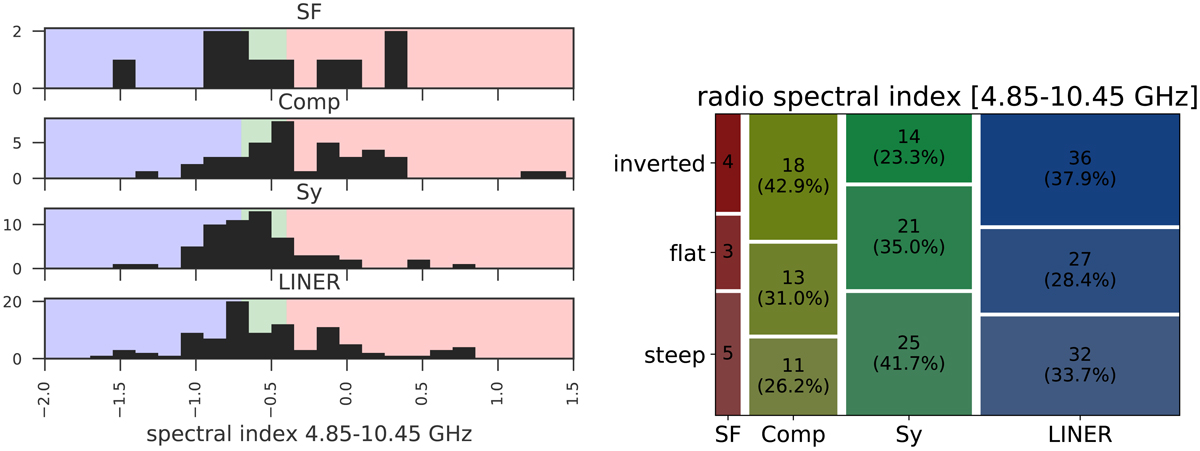
Distribution of the spectral slope α[4.85–10.45] at higher frequencies among different spectral classes of galaxies. Left: two-point spectral index distribution α[4.85–10.45] for different optical spectral classes of galaxies (SF, composites, Seyferts, and LINERs). The mean and median values are listed in Table 1. Right: fractional distribution of steep, flat, and inverted sources among star-forming, composite, Seyfert, and LINER galaxies.
Current usage metrics show cumulative count of Article Views (full-text article views including HTML views, PDF and ePub downloads, according to the available data) and Abstracts Views on Vision4Press platform.
Data correspond to usage on the plateform after 2015. The current usage metrics is available 48-96 hours after online publication and is updated daily on week days.
Initial download of the metrics may take a while.