Free Access
Fig. 4.
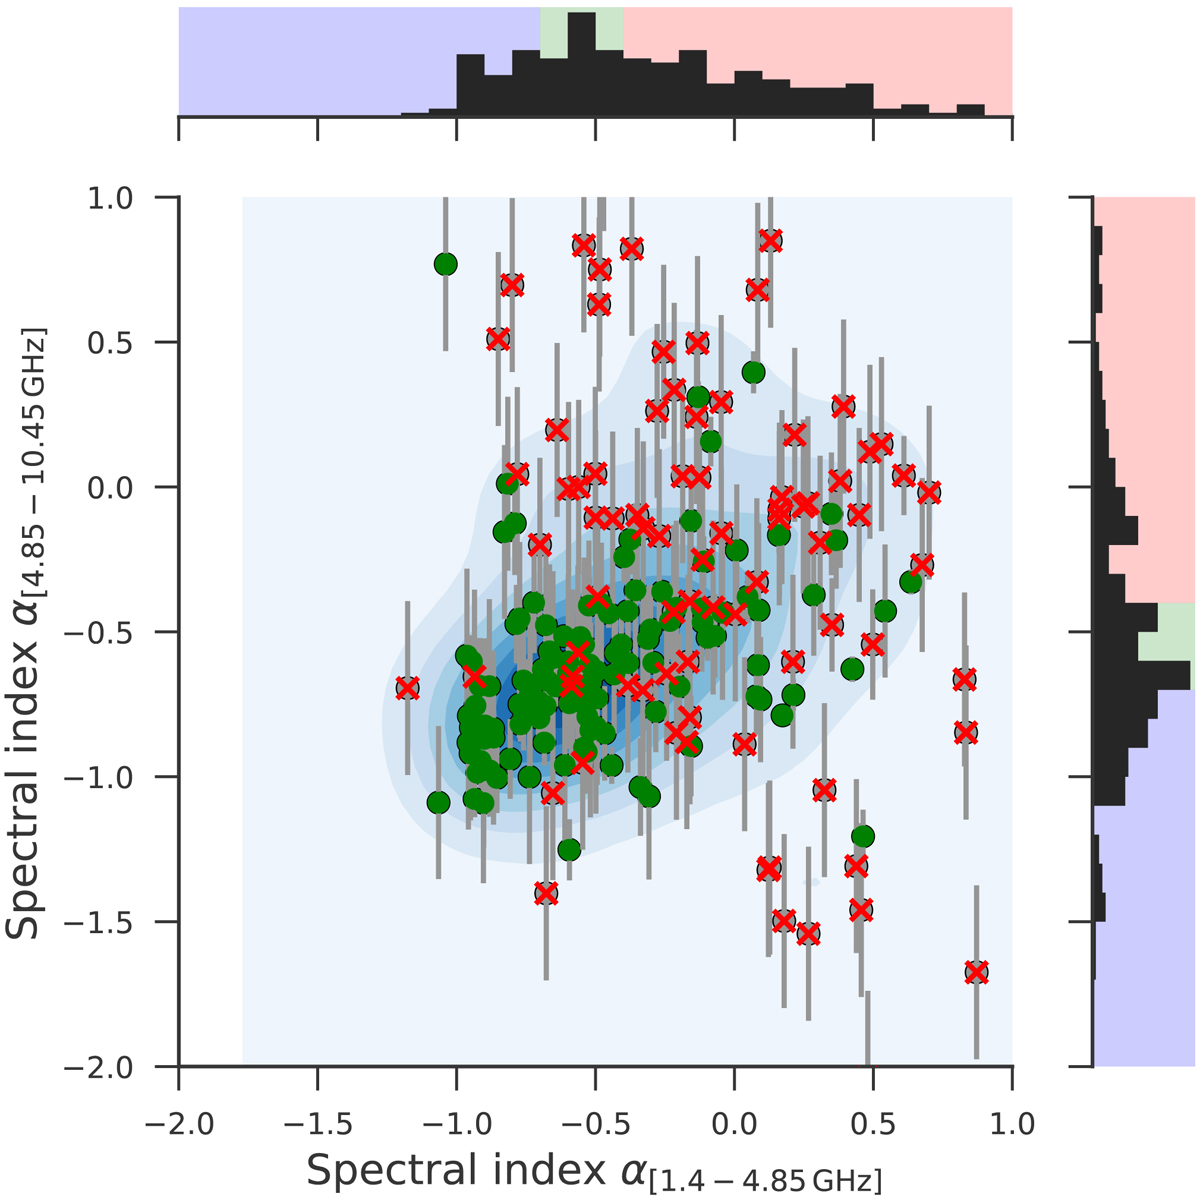
Two-dimensional distribution of spectral indices at lower (x-axis) and higher frequencies (y-axis). The green points mark the high-flux sources, while the red crosses depict the low-flux sample. Some of the sources have error bars for α[4.85–10.45] to show typical uncertainties of the spectral index.
Current usage metrics show cumulative count of Article Views (full-text article views including HTML views, PDF and ePub downloads, according to the available data) and Abstracts Views on Vision4Press platform.
Data correspond to usage on the plateform after 2015. The current usage metrics is available 48-96 hours after online publication and is updated daily on week days.
Initial download of the metrics may take a while.