Fig. 3.
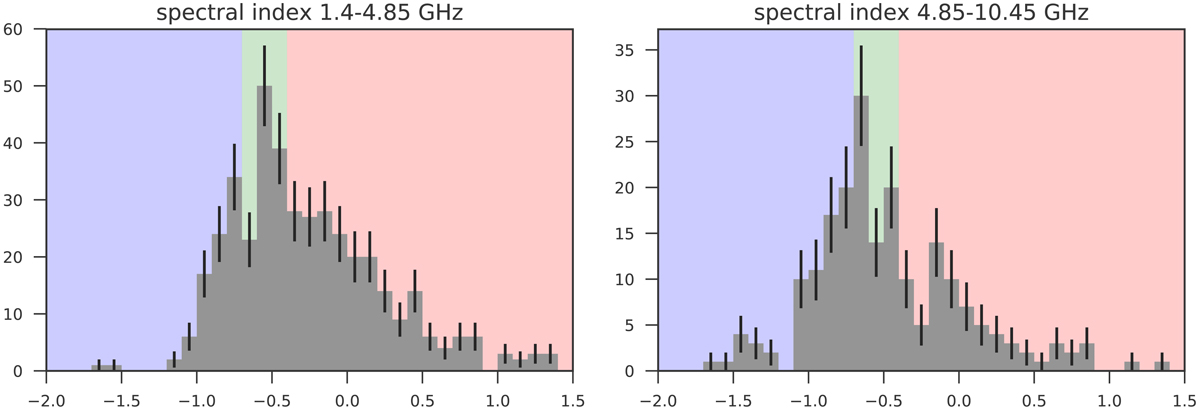
Distributions of spectral indices α[1.4–4.85] and α[4.85–10.45]. Left panel: a two-point spectral index (α[1.4–4.85]) distribution for the combined low-flux and high-flux sample (in total 417 sources). Right panel: a two-point spectral index (α[4.85–10.45]) distribution for the combined low-flux and high-flux sample (in total 209 sources).
Current usage metrics show cumulative count of Article Views (full-text article views including HTML views, PDF and ePub downloads, according to the available data) and Abstracts Views on Vision4Press platform.
Data correspond to usage on the plateform after 2015. The current usage metrics is available 48-96 hours after online publication and is updated daily on week days.
Initial download of the metrics may take a while.