Fig. 2.
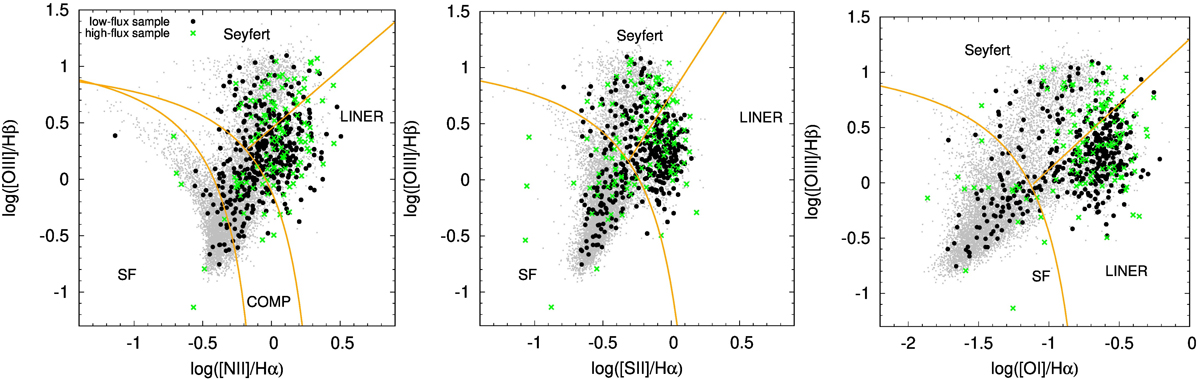
Low- and high-flux sample distribution in different optical diagnostic (BPT) diagrams. Left: [NII]-based diagnostic diagrams of the parent (grey) and Effelsberg samples: a low-flux sample represented by black points and a high-flux sample denoted by green crosses. Demarcation lines were derived by Kewley et al. (2001) to set an upper limit for the star-forming galaxies and by Kauffmann et al. (2003) to distinguish purely star-forming galaxies. The dividing line between Seyferts and LINERs was derived by Schawinski et al. (2007). The new Effelsberg sample (black points), extended towards lower radio fluxes, covers the whole diagnostic diagram. Middle: same samples as in the left panel in [SII]-based diagnostic diagram. Right: high- and low-flux samples in [OI]-based diagram.
Current usage metrics show cumulative count of Article Views (full-text article views including HTML views, PDF and ePub downloads, according to the available data) and Abstracts Views on Vision4Press platform.
Data correspond to usage on the plateform after 2015. The current usage metrics is available 48-96 hours after online publication and is updated daily on week days.
Initial download of the metrics may take a while.