Fig. 15.
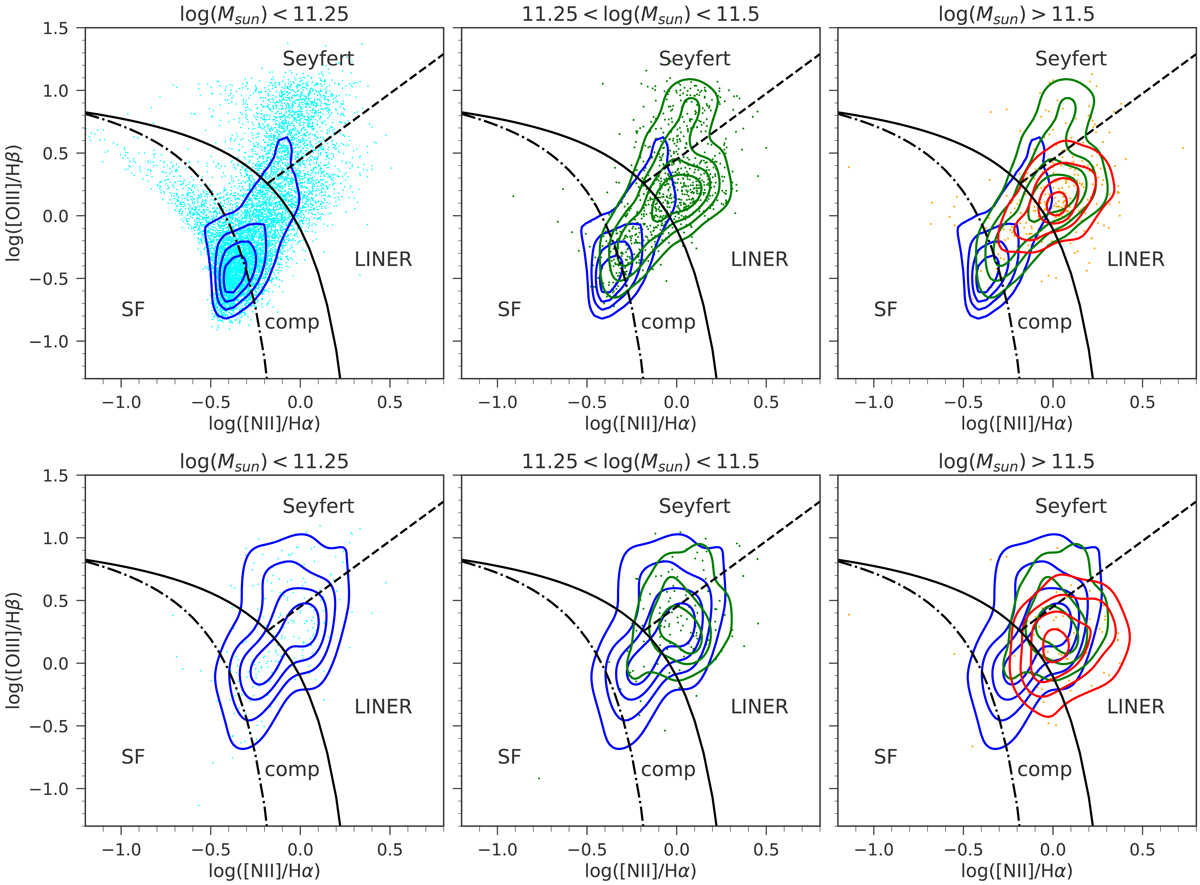
Distribution of the average stellar mass across the parent and the low + high flux sample. Top panel: SDSS-FIRST distribution of stellar masses in the optical BPT diagram for the whole parent sample. From the left to the right figures: galaxies with the average stellar mass in the range log(M⋆[M⊙]) < 11.25, 11.25 < log(M⋆[M⊙]) < 11.5, log(M⋆[M⊙]) > 11.5, respectively, are represented with density contours. Bottom panel: distribution of the average stellar mass across the BPT diagram for the same mass bins as in the top panel, but for the combined low + high flux sample.
Current usage metrics show cumulative count of Article Views (full-text article views including HTML views, PDF and ePub downloads, according to the available data) and Abstracts Views on Vision4Press platform.
Data correspond to usage on the plateform after 2015. The current usage metrics is available 48-96 hours after online publication and is updated daily on week days.
Initial download of the metrics may take a while.