Fig. 13.
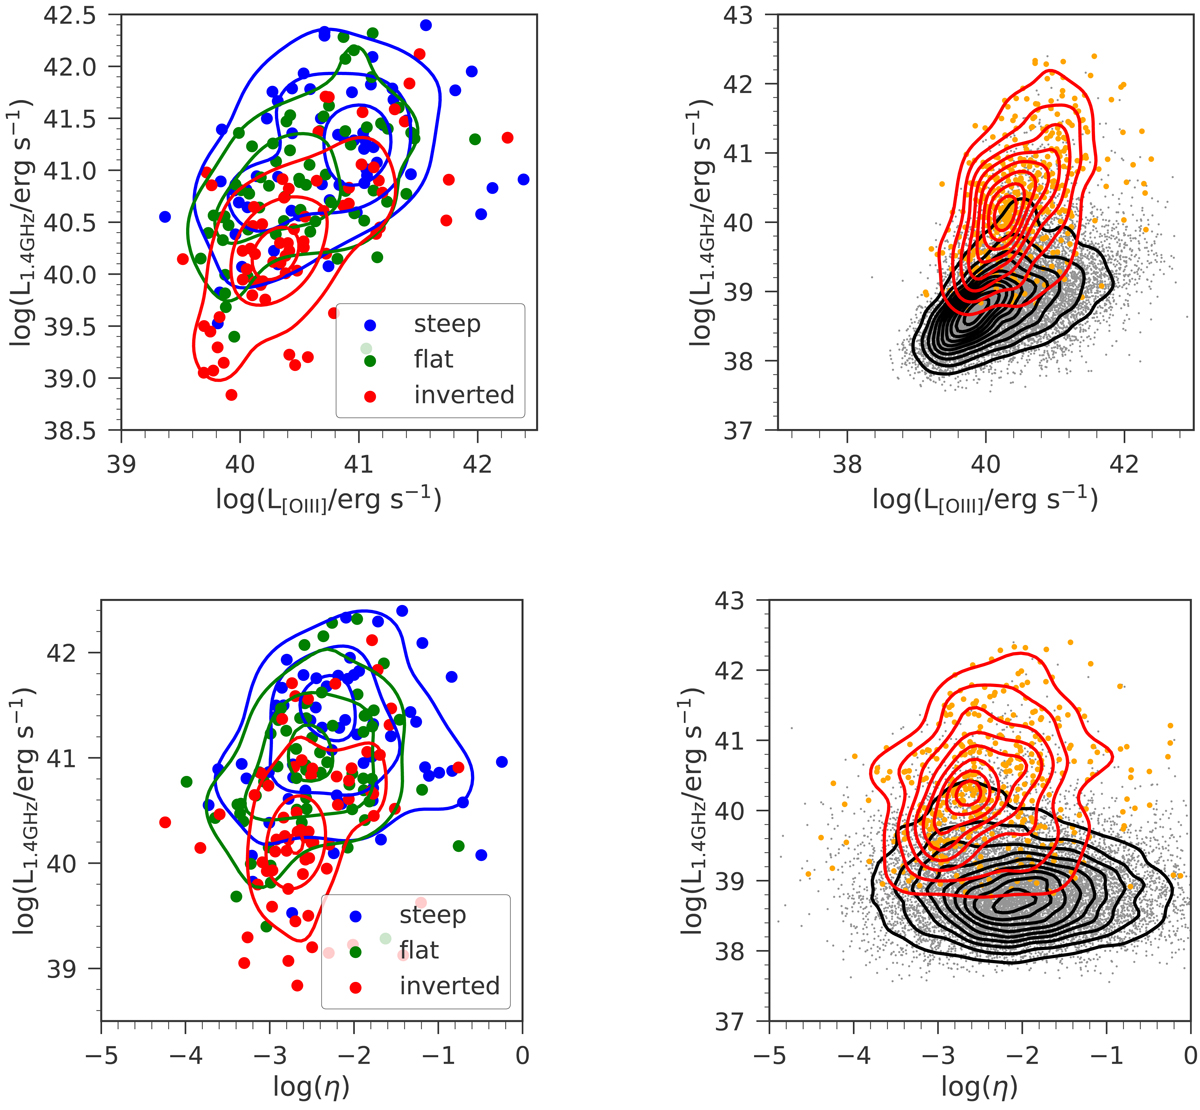
Distribution of the Effelsberg sources with respect to the radio luminosity, luminosity of [O III] line, and the Eddington ratio. Top row–left panel: distribution of the radio spectral index α[4.85–10.45] with respect to the radio luminosity L1.4 GHz and the luminosity of [O III] line. Right panel: localization of the Effelsberg sources (low + high flux; orange points) in the plane of L1.4 GHz and L[OIII] with respect to the parent sample (grey points). Bottom row–left panel: distribution of steep, flat, and inverted radio spectral indices with respect to the radio luminosity L1.4 GHz and the Eddington ratio η. Right panel: distribution of the Effelsberg sources (orange points) in the same plane as in the left figure with respect to the parent sample (grey points).
Current usage metrics show cumulative count of Article Views (full-text article views including HTML views, PDF and ePub downloads, according to the available data) and Abstracts Views on Vision4Press platform.
Data correspond to usage on the plateform after 2015. The current usage metrics is available 48-96 hours after online publication and is updated daily on week days.
Initial download of the metrics may take a while.