| Issue |
A&A
Volume 630, October 2019
|
|
|---|---|---|
| Article Number | A90 | |
| Number of page(s) | 12 | |
| Section | Catalogs and data | |
| DOI | https://doi.org/10.1051/0004-6361/201731578 | |
| Published online | 25 September 2019 | |
Hα emission-line stars in molecular clouds
III. Canis Major⋆
1
Observational Astronomy, Division of Astronomy and Space Physics, Department of Physics and Astronomy, Uppsala University, Box 516 751 20 Uppsala, Sweden
e-mail: This email address is being protected from spambots. You need JavaScript enabled to view it.
2
Institute for Astronomy, University of Hawaii at Manoa, 640 North Aohoku Place, Hilo, HI 96720, USA
Received:
16
July
2017
Accepted:
24
July
2019
Abstract
A deep objective-prism survey for Hα emission stars towards the Canis Major star-forming clouds was performed. A total of 398 Hα emitters were detected, 353 of which are new detections. There is a strong concentration of these Hα emitters towards the molecular clouds surrounding the CMa OB1 association, and it is likely that these stars are young stellar objects recently born in the clouds. An additional population of Hα emitters is scattered all across the region, and probably includes unrelated foreground dMe stars and background Be stars. About 90% of the Hα emitters are detected by WISE, of which 75% was detected with usable photometry. When plotted in a WISE colour–colour diagram it appears that the majority are Class II YSOs. Coordinates and finding charts are provided for all the new stars, and coordinates for all the detections. We searched the Gaia-DR2 catalogue and from 334 Hα emission stars with useful parallaxes, we selected a subset of 98 stars that have parallax errors of less than 20% and nominal distances in the interval 1050 to 1350 pc that surrounds a strong peak at 1185 pc in the distance distribution. Similarly, Gaia distances were obtained for 51 OB-stars located towards Canis Major and selected with the same parallax errors as the Hα stars. We find a median distance for the OB stars of 1182 pc, in excellent correspondence with the distance from the Hα stars. Two known runaway stars are confirmed as members of the association. Finally, two new Herbig-Haro objects are identified.
Key words: stars: emission-line / Be / stars: pre-main sequence / stars: formation
Full Table 2 is only available at the CDS via anonymous ftp to cdsarc.u-strasbg.fr (130.79.128.5) or via http://cdsarc.u-strasbg.fr/viz-bin/cat/J/A+A/630/A90
© ESO 2019
1. Introduction
Objective prism surveys for Hα emission stars were the first technique to identify large populations of young stars (e.g. Haro 1953; Herbig 1954). Over time, many of the closer star forming regions were surveyed (e.g. Schwartz 1977). These early surveys were all done using photographic plates, but with the advent of CCDs combined with grisms, much deeper surveys were possible, albeit over much smaller areas (e.g. Herbig 1998; Herbig & Dahm 2006). We performed a major survey of Hα emission stars in southern star-forming regions based on a large set of wide-field photographic films obtained in the late 1990s at the European Southern Observatory (ESO) Schmidt telescope with objective prism before it was closed down. In Paper I (Reipurth et al. 2004) we studied NGC 2264 and presented 357 Hα emission-line stars, of which 244 were new. In Paper II (Pettersson et al. 2014) we studied the M 42 region and presented 1699 Hα emitters, of which 1025 were new detections. In this paper we present the results of our survey of the Canis Major star-forming region.
CMa OB1 was first recognised as a stellar association by Ambartsumian (1947), and more members were identified by Claría (1974a, b). Within the boundaries of CMa OB1, van den Bergh (1966) found a number of stars associated with reflection nebulae, a grouping that he called CMa R1. These stars were studied in more detail by Racine (1968). The relation between CMa OB1 and CMa R1 was disputed for some time, but it is now recognised that they are part of the same association of young stars. The distance to CMa OB1 has been estimated multiple times, with results varying from 690 pc to 1150 pc. The large spread in values is not surprising given that towards Canis Major we are looking at a shallow angle down the Orion-Cygnus arm for almost 2 kpc, with the Perseus arm further behind. In the following we present an accurate Gaia-DR2 determination of the distance to the young stars in this region.
The HII region excited by the OB stars, Sh2-296, is particularly pronounced towards the west, where it is bounded by a ridge of molecular clouds that are outlined in the CO studies of, for example Dame et al. (2001), and in the extinction studies of Dobashi (2011) and Lombardi et al. (2011). Herbst & Assousa (1977) suggested that star formation in the ring-like structure of interstellar matter surrounding CMa OB1 and CMa R1 has been triggered by a supernova. This was supported by the study of Comerón et al. (1998), who used HIPPARCOS to investigate the motions of the O and B stars, and found a new runaway star, HD 57682, that ∼106 yr ago passed through the estimated centre of expansion of the association. Shevchenko et al. (1999) identified many probable members of the association.
Young low-mass stars have formed in the Canis Major clouds. The most famous is the FUor Z CMa (e.g. Hartmann et al. 1989), which is located in the large cloud complex, L1657, to the west of the OB association. A number of Hα emission-line stars have been found in Canis Major. Wackerling (1970) discovered some in his early-type, emission-line survey across the sky, and Stephenson & Sanduleak (1977) included Canis Major in their general Hα emission survey along the Milky Way. The first Hα emission star survey dedicated to the Canis Major region was by Wiramihardja et al. (1986), who catalogued 129 emission-line stars. Later, Sugitani et al. (1995) observed a small bright-rimmed core, BRC 27, along the L1657 cloud edge and found infrared (IR)-excess stars there, and subsequently Ogura et al. (2002) found 32 Hα emission stars towards the same cloud core. Soares & Bica (2002, 2003) used the 2MASS catalogue to study four small clusterings of young stars, including BRC 27. Gregorio-Hetem et al. (2009) and Fernandes et al. (2015) used X-ray data from ROSAT to identify young stars across a ∼5 sq. degrees field, mainly concentrated in two groupings, one near Z CMa and another near GU CMa. Mallick et al. (2012) presented a multi-wavelength study of the small HII region Sh2-297 at the southern tip of the L1657 cloud, and showed that multiple populations of young stars with ages from 1 to 20 Myr co-exist in this region. Rebull et al. (2013) used Spitzer data to study the young stars in BRC 27. Elia et al. (2013) used Herschel data to study star formation in a large area along the Galactic plane including Canis Major. Most recently, Fischer et al. (2016) used the Wide-Field Infrared Survey Explorer (WISE) to identify many young stars across a very wide area in Canis Major. Below we compare our results to these various studies. Reviews of the literature on the Canis Major star-forming region have been presented by Herbig (1991) and Gregorio-Hetem (2008).
2. Observations
We have used the ESO 1m Schmidt telescope at the La Silla Observatory to obtain objective prism exposures of the Canis Major star-forming region. The objective prism gives a dispersion of 800 Å mm−1 at Hα, as previously described in more detail in Paper I. Sensitised Kodak 4415 emulsion on spectral films was used. A series of exposures were obtained from November 1996 to late January 1997, and from these the seven best films were selected, all taken during photometric nights with good seeing. Exposure times were chosen to vary between 10 min and 150 min in order to detect Hα emission in faint as well as bright stars. A RG 630 filter was used which provides a spectral range from 630 to 690 nm, a narrow range centred on the Hα line. The large films of 30 cm × 30 cm cover a field of  on the sky. All exposures were centred on the position α: 7h04m, δ: −11°28′ (J2000). Table 1 lists the films employed in the present study. The Schmidt films were visually inspected with the use of a binocular microscope in search of emission against the continuum of the stars.
Schmidt films.
The 2nd Digitised Sky Survey (DSS2), which provides B, R, I images with a plate scale of 1″ pixel−1, was used to obtain initial coordinates for the stars. The images were retrieved in FITS format and had astrometric information in their headers. The task SAOimage was used to determine the coordinates of each star visually identified in the finding charts. R-images were used to measure the coordinates for the stars.
These initial coordinates were searched (within a radius of 2″) among the stars of the 2 Micron All Sky Survey (2MASS) catalogue in order to obtain near infrared JHKs magnitudes. The 2MASS coordinates have expected uncertainties of 0.1″, better than what we achieved with the DSS2 images. Therefore, the present survey uses the 2MASS coordinates.
3. Results
3.1. Survey
We have detected 398 Hα emission stars within an area of approximately 14 sq. degrees as outlined in Fig. 1. Among these, 45 Hα emitters were previously known, so 353 objects are new. Finding charts for the new objects are presented in Appendix A. Originally our survey was focused on a rectangular area slightly larger than 3 × 3° centred on the CMa OB association, but a concentration of Hα emitters was spotted to the west, and so the survey was extended to that region, see below for further details.
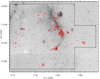 |
Fig. 1. Red image from DSS2 showing surveyed area bordered by a black line. The distribution of all detected emission-line stars is shown, each marked as a red cross. |
The 398 Hα emission stars detected are listed in Table 2, available at the CDS. The table gives the following columns: (1) The ESO-Hα number, extending the numbering of our previous papers in this series. It should be noted that we do not give ESO-Hα numbers to already known Hα stars in order to limit the proliferation of names for the same object. The numbers are in two groups, ESO-Hα 1835 to 2123, and ESO-Hα 2706 to 2769, because we initially had planned another order for this series of survey papers. (2) Previously used designations for stars that have already been discovered in earlier surveys. (3−4) The 2000-coordinates as extracted from the 2MASS catalogue. (5) The Hα strength on a scale from 1 to 5, where 1 is weak emission relative to a stronger continuum and 5 is strong emission against a weaker (or in some cases invisible) continuum. Hyphenated values may represent either variability and/or uncertainty in the estimate. (6) Optical broad band G magnitudes extracted from the Gaia-DR2 catalogue. (7−9) JHKs magnitudes extracted from the 2MASS All-Sky Catalogue. (10−12) [3.4], [4.6], and [12] micron magnitudes from AllWISE. (13) Distance from Gaia-DR2. (14) Distance errors from Gaia-DR2. (15) Notes to individual stars.
Hα emission-line stars in CMa OB 1.
Figure 2 shows the numbers of Hα emitters distributed across the five relative strengths of Hα emission. 60% of the stars are found in strength 2 and 3. Strength 1 may be incomplete, since marginal detections have been removed to ensure, as much as possible, that the list contains only bona fide Hα emitters, even at the expense of completeness. Seven films were examined, and in some cases the Hα strength was found to vary, and in such cases the lower value is shown in Fig. 2.
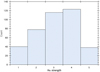 |
Fig. 2. Distribution of emission-line strengths with 1 indicating weak emission relative to the continuum and 5 very strong. |
The brightness distribution of the Hα emitters is shown in Fig. 3, where the 2MASS J-magnitude is used. The steep drop at magnitudes fainter than 15 is likely to imply that our survey is complete only to about that magnitude. Four stars were too faint to be detected in 2MASS J.
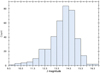 |
Fig. 3. Distribution of J magnitudes of all detected stars as extracted from the 2MASS catalogue. |
3.2. Distribution
The Hα emitting stars are not uniformly spread across the CMa region, but their distribution shows significant substructure, with stars concentrated in several groups. There is a clear association between Hα emitters and the eastern ridge of the bright-rimmed clouds. The clouds surrounding the CMa OB1 association are difficult to discern on the optical image in Fig. 1 so we have used the extinction measurements from Dobashi et al. (2005) to make an extinction map of the region, seen in Fig. 4.
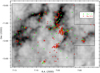 |
Fig. 4. Distribution of detected emission-line stars superposed on an AV extinction map from Dobashi et al. (2005). Stars with Hα strength 1−2 are represented by green triangles and the stronger emitters with Hα strength 3−5 by red crosses. |
The shell-like structure surrounding the main group of OB stars is clearly outlined in extinction, the western side of the shell forms the L1657 cloud, while the north-eastern side is known as L1658 (Lynds 1962). The large majority of Hα emitters are closely associated with these two cloud complexes, especially the L1657 cloud. Figure 5 shows the distribution of Hα emitters on an enlargement of the optical image of the L1657 cloud. Further to the west, in an extension of the survey area, is another cloud, known as TGU-1571 (Dobashi et al. 2005), which is also associated with Hα emitters. In addition to the clusterings of stars associated with these three cloud complexes there are stars that appear in regions of very low extinction, which may have three reasons. First, the stars could be born near the region where they are found out of small clouds that are not easily detected with the extinction mapping technique or, second, they could be slightly older stars that have had time to wander away from their birth sites or, third, they may represent a foreground or background population of unrelated stars, such as dMe or Be stars, respectively. To investigate the second possibility, we assume that a first generation of young stars by now would have weaker Hα emission and thus should be of strength 1 and 2. In Fig. 6 we have plotted the Hα emitters as function of the extinction AV in the general neighbourhood of each star. The columns are divided into strength 1+2 (blue) vs. strength 3+4+5 (red). No obvious correlation between Hα strength and local extinction is seen. Thus it appears that the scattered population of Hα emitters form a mix of isolated star formation and unrelated emission-line stars of other types.
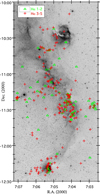 |
Fig. 5. Enlargement of the distribution of Hα emitters towards L1657. Stars with Hα strength 1−2 are represented by green triangles and the stronger emitters with Hα strength 3−5 by red crosses. |
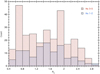 |
Fig. 6. Relative distribution of Hα-emitters as function of the extinction AV along the line of sight. The stronger-line stars do not show a higher affinity of association with molecular clouds than the weaker emission-line stars. |
3.3. IR-excess stars
We have studied the infrared properties of the Hα emitters using the 2MASS and WISE catalogues. Figure 7 shows a J − H vs. H − Ks colour–colour diagram of the Hα emitters. The area between the dashed lines indicate as usual the region where reddened main sequence and giant stars can be found, and for which an infrared excess cannot be unambiguously determined from JHKs photometry. Stars to the right of this area cannot be just reddened main sequence or giant stars, and they clearly have an infrared excess. About 44% of the Hα emitters have such near-infrared excesses. This compares to the 16% of Hα emitters with infrared excess in our identical survey of the general neighbourhood of the Orion Nebula Cluster (Paper II). This might indicate that the stars near the ONC have their circumstellar material more UV-eroded than in the CMa OB1 region. We find that the ratio of strong-vs.-weak emission-line stars (strength 3−4−5 vs. strength 1−2) for the total population of 398 Hα emitters is 2.3, while the same ratio for only the infrared excess stars is 3.4. As expected, the infrared excess stars are more likely to have stronger Hα emission, but at the same time there is clearly not a linear relation between the two quantities. This is not unexpected, since the infrared excess is a measure of the reservoir of circumstellar material near the star whereas the Hα emission is an indicator of current accretion activity.
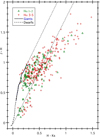 |
Fig. 7. Near-IR colour–colour diagram based on 2MASS data showing all Hα emitters in the survey with 2MASS detections in all three bands (JHKs) (except upper limits). Main sequence and giant loci from Bessell & Brett (1988), corrected to the 2MASS photometric system (Carpenter et al. 2001), and the extinction law from Rieke & Lebofsky (1985) are used in the figure. |
Among the 398 Hα emitters listed here, 75% were detected by WISE (Wide-field Infrared Survey Explorer) with valid photometry in [3.4], [4.6] and [12] bands. Figure 8 shows a WISE [3.4−4.6] vs. [4.6−12] colour–colour diagram. Koenig et al. (2012) empirically determined the approximate boundaries of Class I, II, and III sources in this diagram. We have plotted our sources and have marked strong Hα emitters (group 3−4−5) as red crosses, and weak Hα emitters (group 1−2) as green triangles. The 300 Hα emitters that have WISE detections with valid photometry are distributed across the diagram so 7 objects fall in the Class I area, 221 fall in the Class II area, and 72 fall in the Class III area. The ratios of strong-to-weak Hα emitters are 6:1 for Class I objects, 2.8:1 for Class II objects, and 1.6:1 for Class III objects. The general expectation is that accretion declines with age (e.g. Bertout et al. 2007), and with it Hα emission, so it is gratifying to see that the ratio of strong-to-weak-line objects is decreasing from Class I to Class III objects.
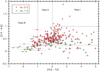 |
Fig. 8. Distribution in a WISE two-colour diagram, of weaker-lined stars (green triangles) and stronger-lined stars (red crosses). The dashed lines separate Class I, II and III sources, see discussion in Koenig et al. (2012). |
Fischer et al. (2016) have used WISE to survey an area of 100 deg2 around Canis Major for young stellar objects, an area almost ten times larger than our survey area. They find 479 YSOs, which they classify as 144 Class I candidates and 335 Class II candidates. Of their 479 objects, 295 fall within the area we have surveyed, but of these only about 1/3 (91 objects) are also detected in our survey. More recently, Sewiło et al. (2019) have used mid-infrared Spitzer and far-infrared Herschel data to identify further embedded sources in the Canis Major clouds, again with limited overlap with our survey. The explanation undoubtedly is that these infrared surveys by their nature are more sensitive to an embedded population, whereas our optical survey almost exclusively is focused on objects with low extinction. Thus the three surveys complement each other rather well.
3.4. Gaia-DR2 distance
There have been a number of attempts to determine the distance to the CMa star-forming region. Racine (1968) used photometry and spectroscopy of the stars with reflection nebulae identified by van den Bergh (1966) to determine a distance of 690 ± 120 pc. Claría (1974b) studied the stars in the CMa OB1 association and found a distance of 1150 ± 140 pc. Shevchenko et al. (1999) studied 88 likely OB stars in the CMa OB association and found a distance of 1050 ± 150 pc. Subsequently, Kaltcheva & Hilditch (2000) used uvbyβ photometry of the brighter OB stars to determine a closer distance of 990 ± 50 pc. Finally, Lombardi et al. (2011) used the observed density of foreground stars with predictions from a galactic model to infer a distance of 1150 ± 64 pc.
With our Hα emission star survey, we can use the Gaia-DR2 catalogue to determine a more accurate distance to the CMa star-forming region (Gaia Collaboration 2016, 2017). All but one of the 398 Hα stars in Table 2 were found in the Gaia-DR2 catalogue within a radius of one arcsec, but of these 28 have no parallax, another 23 have negative parallaxes, and 13 had two objects in the Gaia catalogue. All of these 64 cases were dismissed. The projected spatial distribution of the remaining 334 stars, except 7 stars with distances larger than 10 kpc, is seen in Fig. 9, where stars in the interval from 0 to 800 pc are blue, from 800 to 1500 pc are red, and more distant stars are green. The large majority of stars belong in the intermediate interval, and show a distribution that closely follows the distribution of gas in the region. The nearer and more distant objects are likely dMe dwarfs and Be stars, respectively. The little clump of stars at α = 7:08 and δ = −13:10 is the more distant open cluster NGC 2345. Figure 10 shows a histogram of Gaia distances for all Hα emission-line stars (red). There is a pronounced peak centred between 1.0 and 1.2 kpc corresponding to the CMa young stars, and a small peak at ∼2900 pc from the ∼70 Myr old cluster NGC 2345, located near the Perseus arm.
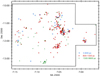 |
Fig. 9. Distribution of Hα emission stars towards the Canis Major star-forming region. Only stars with positive parallaxes nearer than 10 kpc are shown, a total of 327 stars. The stars are divided into nearby stars, from 0 to 800 pc, which are likely dMe dwarfs (blue), from 800 to 1500 pc, which include all the members of the Canis Major association (red), and stars more distant than 1500 pc, which are likely Be stars (green). The red points closely follow the gas surrounding the CMa shell. The small group of green symbols near the bottom of the figure marks the distant cluster NGC 2345. |
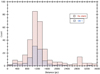 |
Fig. 10. Histogram showing distribution of Hα emitters (red) as function of distance with OB stars (blue) overlaid. The large peak corresponds to the Canis Major association, and the small peak at 2900 pc is the cluster NGC 2345. |
In addition, in Fig. 10 we have plotted the Gaia DR2 distances of all the OB stars (blue) that Claría (1974b) and Shevchenko et al. (1999) have suggested as members of the Canis Major OB association. It is seen that the distribution is almost identical to that of the Hα emission-line stars.
In order to refine the distance determination by eliminating the most uncertain distances and very close and very distant stars, we have selected a subset of Hα emission-line stars that have parallax errors less than 20% and are located between 1050 and 1350 pc, a total of 98 stars. The mean and median of this distribution are 1184 and 1185 pc, respectively, with a standard deviation of 70 pc and standard error of 7.1 pc. We have culled the list of OB stars in a similar way to the Hα emission-line stars. The mean and median of the OB distribution is 1204 and 1182 pc, respectively, with a standard deviation of 83 pc and a standard error of 12 pc, that is, essentially the same as for the Hα emission-line stars. These two independent measurements lend credence to the results.
The standard error is only meaningful if all stars were at the exact same distance, but the CMa shell is about 50 pc in diameter, so assuming an approximately spherical shape of the shell, a fundamental uncertainty for the distance is ∼±25 pc, thus the best distance estimate is 1185 ± 25 pc.
3.5. The runaway stars
Herbst & Assousa (1977) suggested that the characteristic shell structure of molecular clouds seen towards the CMa OB1 association is the result of a supernova explosion. They identified a potential runaway star, the O7V star HD 54662, which is the earliest and brightest member of the CMa OB1 association. However, subsequent studies have cast doubt on its runaway nature, see Mossoux et al. (2018) for a discussion. An alternative runaway candidate was proposed by Comerón et al. (1998) who noted the peculiar motion of the O9IV star HD 57682. We have extracted the Gaia-DR2 parallaxes for these two stars to determine their distance and potential connection to CMa OB1. For HD 54662 we find a distance of 1170 pc, which is identical within errors to the distance we find for the CMa association, as one would expect for the brightest member of the association. For HD 57682 we find a distance of 1241
 pc, which is consistent with the more uncertain photometric distance of Berghoefer et al. (1996). While this is somewhat further away than we determined for the CMa association, both stars are within errors compatible with our distance estimate. It follows that Gaia-DR2 does not help to determine which of the two is the better runaway candidate. Finally, most recently Fernandes et al. (2019) have identified a third runaway star in the region, HD 53974. Unfortunately, Gaia DR2 does not provide a parallax for this star. Fernandes et al. (2019) suggest that the three runaway stars indicate that supernova explosions occurred ∼6 Myr, ∼2 Myr and ∼1 Myr ago, leading to several populations of young stars.
3.6. Herbig-Haro objects
In the course of our survey we noted two new Herbig-Haro objects with their characteristic Hα and [SII] lines. Both objects are located towards high extinction regions and are surrounded by Hα emission-line stars. HH 1174 consists of a single knot, located at 7:04:44.3 −11:07:16 (2000). This is 19 arcsec (0.1 pc) from the IRAS source 07024−1102, which has colours similar to an ultracompact HII region (Slysh et al. 1994), and is associated with an H2O maser (Brand et al. 1994) and a dense 13CO core (Wang et al. 2009). The source is marked as a red asterisk in the upper panel of Fig. 11, which is an Hα image of the region. It seems likely that the HH object is associated with this embedded source.
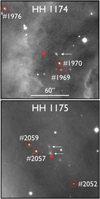 |
Fig. 11. The two Herbig-Haro objects discovered in this survey, HH 1174 and HH 1175, are seen in these Hα images, each 150 arcsec wide, corresponding to ∼0.85 pc. The HH objects are marked with arrows, and surrounding Hα emission stars are indicated by red circles. The probable sources of the two HH flows are marked with red asterisks. Images courtesy John Bally. |
HH 1175 consists of two knots, the coordinates of the brighter one is 7:05:35.4 −10:38:18 (2000). This is 3 arcsec from the embedded source [EFM2013] G224.00452−01.73126 detected by Elia et al. (2013, their source #619) using Herschel, and along the line defined by the two knots, strongly suggesting that this is the driving source of the HH flow. Elia et al. (2013) determine a bolometric luminosity of 6.4 L⊙ (converted to our distance of 1185 pc), and classify it as a protostellar object. The source is marked with a red asterisk in the lower panel of Fig. 11.
4. Conclusions
We have performed a deep objective-prism survey for Hα emission line stars in a region of about 14 sq. degrees covering mainly the Canis Major OB1 region. We have obtained the following results.
-
(1)
A total of 398 Hα emitters were detected, of which 353 are newly discovered. A significant concentration is found associated with the western side of the large shell of clouds surrounding the CMa OB1 association, and they are likely to be mostly young stars. An additional population of Hα emitters is spread over the entire region surveyed, and probably represents a mix of young stars with foreground dMe stars and background Be stars.
-
(2)
All but four of the stars are detected by 2MASS, and the J-magnitude distribution shows a sharp cut-off around J = 15, which is the likely completeness limit. The Hα emission-line strength from 1 (weak) to 5 (strong) shows a broad peak around 3 and 4.
-
(3)
When the Hα emitters are divided into weak (1−2) and strong (3−4−5) emitters and plotted against the visual extinction along each sight line, no correlation is found such that strong Hα emitters are more closely associated with higher extinction regions, as one might otherwise have expected.
-
(4)
Placed in a J − H vs. H − Ks colour–colour diagram, about 44% of the Hα emitters are found to have a near-infrared excess. This compares to only 16% determined in a similar survey of an area around the very young Orion Nebula Cluster, possibly suggesting that the stronger UV radiation near the ONC erodes the circumstellar matter more than in the CMa OB1 region.
-
(5)
The subset of Hα emitters with near-infrared excess are found to be more likely to have strong rather than weak Hα emission (ratio 3.4) than the entire population of Hα emitters (ratio 2.3).
-
(6)
300 of the 398 Hα emitters were detected by WISE, and when plotted in a calibrated [3.4−4.6] vs. [4.6−12] colour-colour diagram it is found that 7 objects fall in the Class I area, 221 fall in the Class II area, and 72 fall in the Class III area. The ratios of strong-to-weak Hα emitters for Class I, II, and III objects are 6, 2.8, and 1.6, respectively.
-
(7)
All but one of the 398 Hα emitters were found in the Gaia-DR2 catalogue, and from these 327 with positive parallaxes were selected. Among these, 98 stars with parallax errors less than 20% and with nominal distances from 1050 to 1350 pc were selected, showing a well-defined peak at a median distance of 1185 pc. The standard error on this is 7.1 pc, but since the extent of the association in the plane of the sky is about 50 pc, a more realistic value for the Canis Major association is 1185 ± 25 pc.
-
(8)
We have used the compilations of OB stars towards Canis Major presented by Claría (1974b) and Shevchenko et al. (1999) and have selected 51 stars which have Gaia-DR2 parallax errors of less than 20% and nominal distances in the range 1050−1350 pc, similar to the Hα emission-line stars. The median distance for these OB stars is 1182 ± 12 pc, in excellent correspondence with the value found from the Hα emission-line stars. We also extract Gaia-DR2 distances to the two runaway candidate O-stars in the region, finding values of
 pc for HD 54662, and
  pc for HD 57682, confirming that both stars are members of the CMa OB1 association.
 -
(9)
While searching for the Hα emission stars, we discovered two Herbig-Haro objects, here named HH 1174 and 1175, located towards high extinction regions of the L1657 cloud, and we identified embedded sources that are likely their driving sources.
Acknowledgments
We are grateful to Guido and Oscar Pizarro, who as telescope operators obtained all the films used in this survey, and to John Bally for obtaining the images in Fig. 11. We acknowledge use of the Digitised Sky Survey, which was produced at the Space Telescope Science Institute under US Government grant NAG W-2166. This work has made use of data from the European Space Agency (ESA) mission Gaia (https://www.cosmos.esa.int/gaia), processed by the Gaia Data Processing and Analysis Consortium (DPAC, https://www.cosmos.esa.int/web/gaia/dpac/consortium). Funding for the DPAC has been provided by national institutions, in particular the institutions participating in the Gaia Multilateral Agreement. This publication makes use of data products from the Wide-field Infrared Survey Explorer and from the Two Micron All Sky Survey. This research has made use of the SIMBAD database, operated at CDS, Strasbourg, France, and of NASA’s Astrophysics Data System Bibliographic Services. Facility: ESO 1m Schmidt telescope, Gaia, 2MASS, WISE.
References
- Ambartsumian, V. A. 1947, Stellar Evolution and Astrophysics (Yerevan: Armenian Acad. of Sci.), 12 [Google Scholar]
- Berghoefer, T. W., Schmitt, J. H. M. M., & Cassinelli, J. P. 1996, A&AS, 118, 481 [NASA ADS] [CrossRef] [EDP Sciences] [Google Scholar]
- Bertout, C., Siess, L., & Cabrit, S. 2007, A&A, 473, L21 [NASA ADS] [CrossRef] [EDP Sciences] [Google Scholar]
- Bessell, M. S., & Brett, J. M. 1988, PASP, 100, 1134 [NASA ADS] [CrossRef] [Google Scholar]
- Brand, J., Cesaroni, R., Caselli, P., et al. 1994, A&AS, 103, 541 [NASA ADS] [Google Scholar]
- Carpenter, J. M., Hillenbrand, L. A., & Skrutskie, M. F. 2001, AJ, 121, 3160 [NASA ADS] [CrossRef] [Google Scholar]
- Claría, J. J. 1974a, AJ, 79, 1022 [NASA ADS] [CrossRef] [Google Scholar]
- Claría, J. J. 1974b, A&A, 37, 229 [NASA ADS] [Google Scholar]
- Comerón, F., Torra, J., & Gomez, A. E. 1998, A&A, 330, 975 [Google Scholar]
- Dame, T. M., Hartmann, D., & Thaddeus, P. 2001, ApJ, 547, 792 [NASA ADS] [CrossRef] [Google Scholar]
- Dobashi, K. 2011, PASJ, 63, S1 [NASA ADS] [CrossRef] [Google Scholar]
- Dobashi, K., Uehara, H., Kandori, R., et al. 2005, PASJ, 57, S1 [NASA ADS] [CrossRef] [Google Scholar]
- Elia, D., Molinari, S., Fukui, Y., et al. 2013, ApJ, 772, 45 [NASA ADS] [CrossRef] [Google Scholar]
- Fernandes, B., Gregorio-Hetem, J., Montmerle, T., & Rojas, G. 2015, MNRAS, 448, 119 [NASA ADS] [CrossRef] [Google Scholar]
- Fernandes, B., Montmerle, T., Santos-Silva, T., & Gregorio-Hetem, J. 2019, A&A, 628, A44 [NASA ADS] [CrossRef] [EDP Sciences] [Google Scholar]
- Fischer, W. J., Padgett, D. L., Stapelfeldt, K. L., & Sewiło, M. 2016, ApJ, 827, 96 [NASA ADS] [CrossRef] [Google Scholar]
- Gaia Collaboration (Prusti, T., et al.) 2016, A&A, 595, A1 [NASA ADS] [CrossRef] [EDP Sciences] [Google Scholar]
- Gaia Collaboration (Clementini, G., et al.) 2017, A&A, 605, A79 [NASA ADS] [CrossRef] [EDP Sciences] [Google Scholar]
- Gregorio-Hetem, J. 2008, in Handbook of Star Forming Regions, Volume II, ed. B. Reipurth (ASP), 1 [Google Scholar]
- Gregorio-Hetem, J., Montmerle, T., Rodrigues, C. V., et al. 2009, A&A, 506, 711 [NASA ADS] [CrossRef] [EDP Sciences] [Google Scholar]
- Haro, G. 1953, ApJ, 117, 73 [NASA ADS] [CrossRef] [Google Scholar]
- Hartmann, L., Kenyon, S. J., Hewett, R., et al. 1989, ApJ, 338, 1001 [NASA ADS] [CrossRef] [Google Scholar]
- Herbig, G. H. 1954, ApJ, 119, 483 [NASA ADS] [CrossRef] [Google Scholar]
- Herbig, G. H. 1960, ApJS, 4, 337 [NASA ADS] [CrossRef] [Google Scholar]
- Herbig, G. H. 1991, in Low Mass Star Formation in Southern Molecular Clouds, ed. B. Reipurth (ESO Scientific Report), 11, 59 [NASA ADS] [Google Scholar]
- Herbig, G. H. 1998, ApJ, 497, 736 [NASA ADS] [CrossRef] [Google Scholar]
- Herbig, G. H., & Dahm, S. E. 2006, AJ, 131, 1530 [NASA ADS] [CrossRef] [Google Scholar]
- Herbst, W., & Assousa, G. E. 1977, ApJ, 217, 473 [NASA ADS] [CrossRef] [Google Scholar]
- Kaltcheva, N. T., & Hilditch, R. W. 2000, MNRAS, 312, 753 [NASA ADS] [CrossRef] [Google Scholar]
- Koenig, X. P., Leisawitz, D. T., Benford, D. J., et al. 2012, ApJ, 744, 130 [NASA ADS] [CrossRef] [Google Scholar]
- Lombardi, M., Alves, J., & Lada, C. J. 2011, A&A, 535, A16 [NASA ADS] [CrossRef] [EDP Sciences] [Google Scholar]
- Lynds, B. T. 1962, ApJS, 7, 1 [NASA ADS] [CrossRef] [Google Scholar]
- Mallick, K. K., Ojha, D. K., Samal, M. R., et al. 2012, ApJ, 759, 48 [NASA ADS] [CrossRef] [Google Scholar]
- Mossoux, E., Mahy, L., & Rauw, G. 2018, A&A, 615, A19 [NASA ADS] [CrossRef] [EDP Sciences] [Google Scholar]
- Ogura, K., Sugitani, K., & Pickles, A. 2002, AJ, 123, 2597 [NASA ADS] [CrossRef] [Google Scholar]
- Pettersson, B., Armond, T., & Reipurth, B. 2014, A&A, 570, A30 [NASA ADS] [CrossRef] [EDP Sciences] [Google Scholar]
- Racine, R. 1968, AJ, 73, 233 [CrossRef] [Google Scholar]
- Rebull, L. M., Johnson, C. H., Gibbs, J. C., et al. 2013, AJ, 145, 15 [NASA ADS] [CrossRef] [Google Scholar]
- Reipurth, B., Pettersson, B., Armond, T., Bally, J., & Vaz, L. P. R. 2004, AJ, 127, 1117 [NASA ADS] [CrossRef] [Google Scholar]
- Rieke, G. H., & Lebofsky, M. J. 1985, ApJ, 288, 618 [NASA ADS] [CrossRef] [Google Scholar]
- Schwartz, R. D. 1977, ApJS, 35, 161 [Google Scholar]
- Sewiło, M., Whitney, B. A., Yung, B. H. K., et al. 2019, ApJS, 240, 26 [NASA ADS] [CrossRef] [Google Scholar]
- Shevchenko, V. S., Ezhkova, O. V., Ibrahimov, M. A., van den Ancker, M. E., & Tjin A Djie, H. R. E. 1999, MNRAS, 310, 210 [NASA ADS] [CrossRef] [Google Scholar]
- Slysh, V. I., Dzura, A. M., Val’tts, I. E., & Gerard, E. 1994, A&AS, 106, 87 [NASA ADS] [Google Scholar]
- Soares, J. B., & Bica, E. 2002, A&A, 388, 172 [NASA ADS] [CrossRef] [EDP Sciences] [Google Scholar]
- Soares, J. B., & Bica, E. 2003, A&A, 404, 217 [NASA ADS] [CrossRef] [EDP Sciences] [Google Scholar]
- Stephenson, C. B., & Sanduleak, N. 1977, ApJS, 33, 459 [NASA ADS] [CrossRef] [Google Scholar]
- Sugitani, K., Tamura, M., & Ogura, K. 1995, ApJ, 455, L39 [NASA ADS] [CrossRef] [Google Scholar]
- van den Bergh, S. 1966, AJ, 71, 990 [NASA ADS] [CrossRef] [Google Scholar]
- Wackerling, L. R. 1970, MNRAS, 149, 405 [NASA ADS] [CrossRef] [Google Scholar]
- Wang, K., Wu, Y. F., Ran, L., Yu, W. T., & Miller, M. 2009, A&A, 507, 369 [NASA ADS] [CrossRef] [EDP Sciences] [Google Scholar]
- Wiramihardja, S. D., Kogure, T., Nakano, M., & Yoshida, S. 1986, PASJ, 38, 395 [NASA ADS] [Google Scholar]
Appendix A: Finding charts
In this appendix we provide finding charts for all of the new Hα emission-line stars presented in this paper. The image stamps, each 90″ × 90″, were obtained from red DSS2 images.
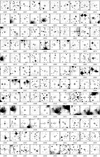 |
Fig. A.1. Finding charts, 90″ to a side. |
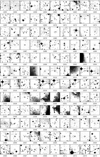 |
Fig. A.1. continued. |
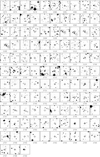 |
Fig. A.1. continued. |
All Tables
All Figures
|
Fig. 1. Red image from DSS2 showing surveyed area bordered by a black line. The distribution of all detected emission-line stars is shown, each marked as a red cross. |
| In the text | |
|
Fig. 2. Distribution of emission-line strengths with 1 indicating weak emission relative to the continuum and 5 very strong. |
| In the text | |
|
Fig. 3. Distribution of J magnitudes of all detected stars as extracted from the 2MASS catalogue. |
| In the text | |
|
Fig. 4. Distribution of detected emission-line stars superposed on an AV extinction map from Dobashi et al. (2005). Stars with Hα strength 1−2 are represented by green triangles and the stronger emitters with Hα strength 3−5 by red crosses. |
| In the text | |
|
Fig. 5. Enlargement of the distribution of Hα emitters towards L1657. Stars with Hα strength 1−2 are represented by green triangles and the stronger emitters with Hα strength 3−5 by red crosses. |
| In the text | |
|
Fig. 6. Relative distribution of Hα-emitters as function of the extinction AV along the line of sight. The stronger-line stars do not show a higher affinity of association with molecular clouds than the weaker emission-line stars. |
| In the text | |
|
Fig. 7. Near-IR colour–colour diagram based on 2MASS data showing all Hα emitters in the survey with 2MASS detections in all three bands (JHKs) (except upper limits). Main sequence and giant loci from Bessell & Brett (1988), corrected to the 2MASS photometric system (Carpenter et al. 2001), and the extinction law from Rieke & Lebofsky (1985) are used in the figure. |
| In the text | |
|
Fig. 8. Distribution in a WISE two-colour diagram, of weaker-lined stars (green triangles) and stronger-lined stars (red crosses). The dashed lines separate Class I, II and III sources, see discussion in Koenig et al. (2012). |
| In the text | |
|
Fig. 9. Distribution of Hα emission stars towards the Canis Major star-forming region. Only stars with positive parallaxes nearer than 10 kpc are shown, a total of 327 stars. The stars are divided into nearby stars, from 0 to 800 pc, which are likely dMe dwarfs (blue), from 800 to 1500 pc, which include all the members of the Canis Major association (red), and stars more distant than 1500 pc, which are likely Be stars (green). The red points closely follow the gas surrounding the CMa shell. The small group of green symbols near the bottom of the figure marks the distant cluster NGC 2345. |
| In the text | |
|
Fig. 10. Histogram showing distribution of Hα emitters (red) as function of distance with OB stars (blue) overlaid. The large peak corresponds to the Canis Major association, and the small peak at 2900 pc is the cluster NGC 2345. |
| In the text | |
|
Fig. 11. The two Herbig-Haro objects discovered in this survey, HH 1174 and HH 1175, are seen in these Hα images, each 150 arcsec wide, corresponding to ∼0.85 pc. The HH objects are marked with arrows, and surrounding Hα emission stars are indicated by red circles. The probable sources of the two HH flows are marked with red asterisks. Images courtesy John Bally. |
| In the text | |
|
Fig. A.1. Finding charts, 90″ to a side. |
| In the text | |
|
Fig. A.1. continued. |
| In the text | |
|
Fig. A.1. continued. |
| In the text | |
Current usage metrics show cumulative count of Article Views (full-text article views including HTML views, PDF and ePub downloads, according to the available data) and Abstracts Views on Vision4Press platform.
Data correspond to usage on the plateform after 2015. The current usage metrics is available 48-96 hours after online publication and is updated daily on week days.
Initial download of the metrics may take a while.