Free Access
Fig. 10.
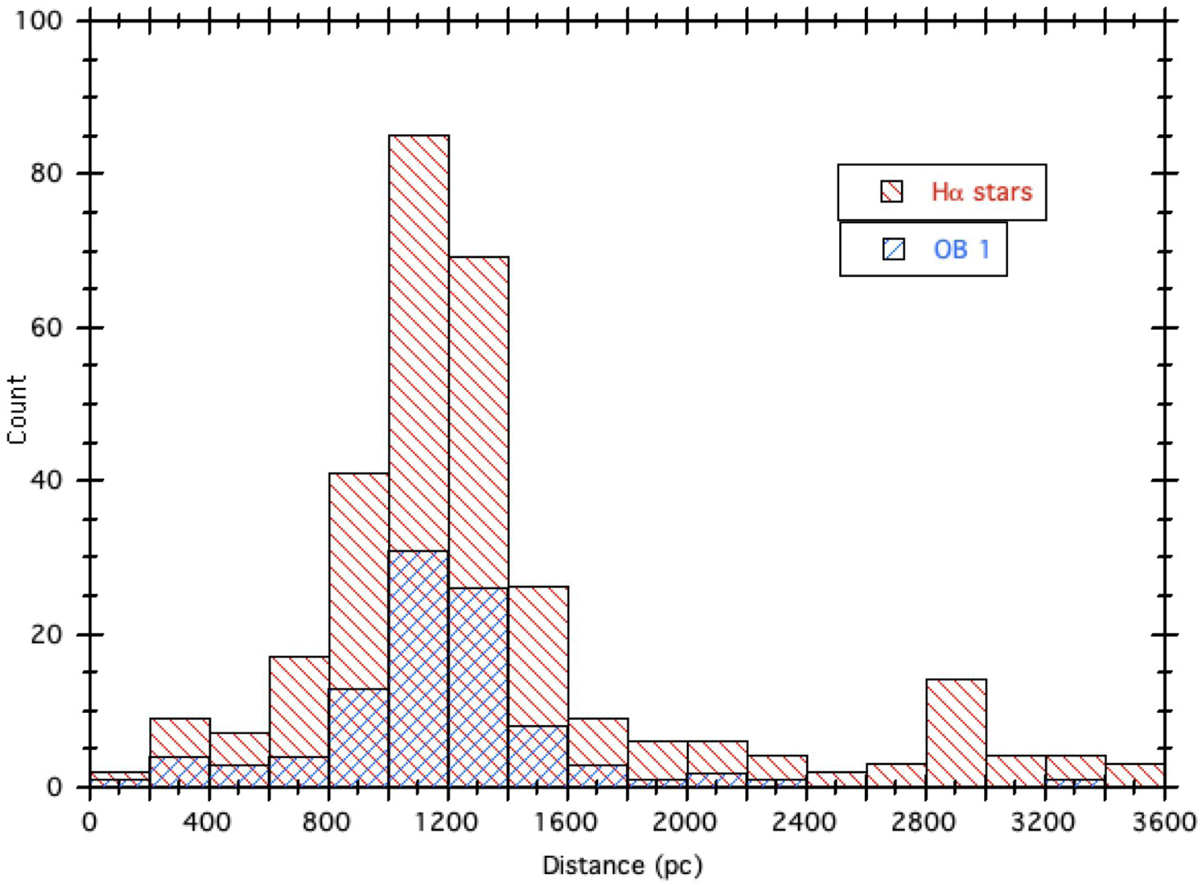
Histogram showing distribution of Hα emitters (red) as function of distance with OB stars (blue) overlaid. The large peak corresponds to the Canis Major association, and the small peak at 2900 pc is the cluster NGC 2345.
Current usage metrics show cumulative count of Article Views (full-text article views including HTML views, PDF and ePub downloads, according to the available data) and Abstracts Views on Vision4Press platform.
Data correspond to usage on the plateform after 2015. The current usage metrics is available 48-96 hours after online publication and is updated daily on week days.
Initial download of the metrics may take a while.