Free Access
Fig. 1.
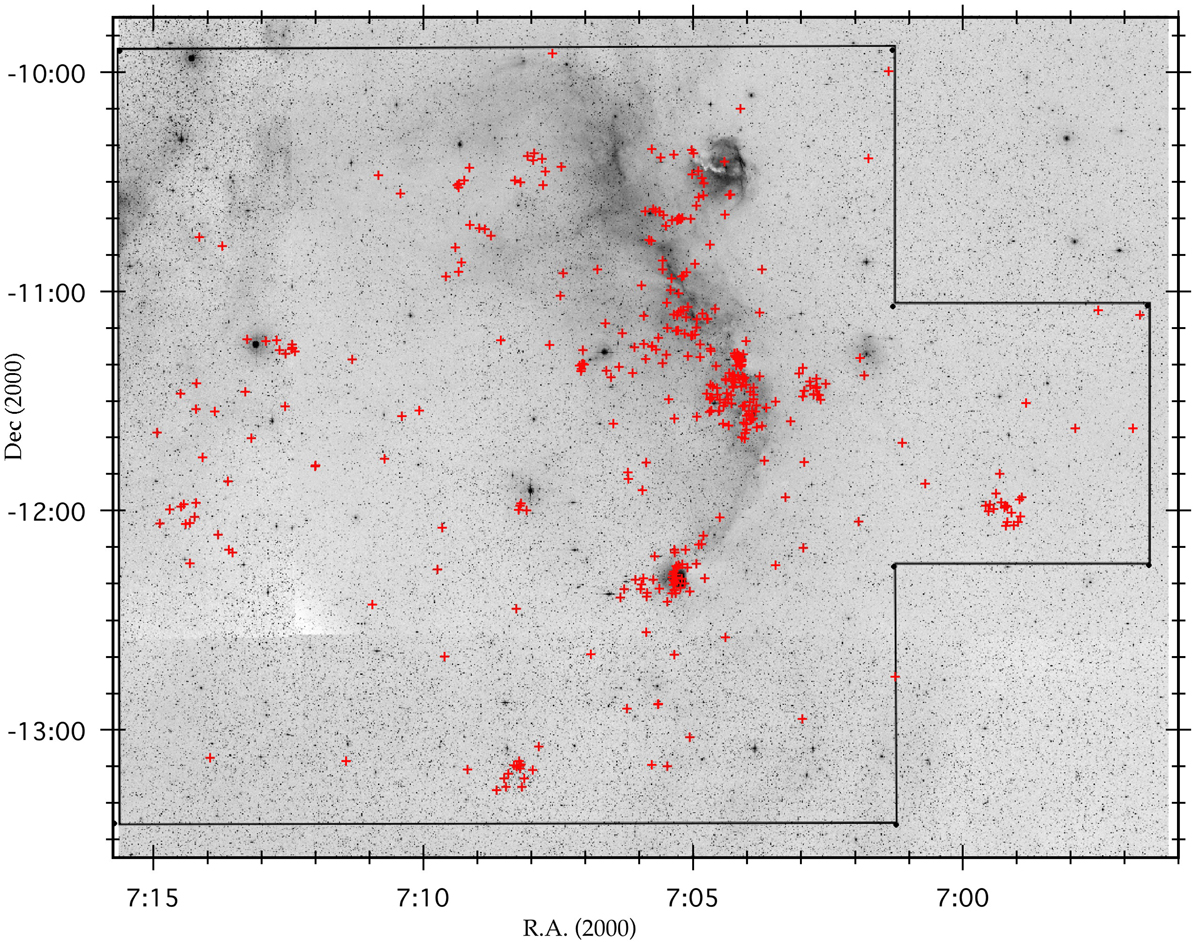
Red image from DSS2 showing surveyed area bordered by a black line. The distribution of all detected emission-line stars is shown, each marked as a red cross.
Current usage metrics show cumulative count of Article Views (full-text article views including HTML views, PDF and ePub downloads, according to the available data) and Abstracts Views on Vision4Press platform.
Data correspond to usage on the plateform after 2015. The current usage metrics is available 48-96 hours after online publication and is updated daily on week days.
Initial download of the metrics may take a while.