| Issue |
A&A
Volume 629, September 2019
|
|
|---|---|---|
| Article Number | A54 | |
| Number of page(s) | 9 | |
| Section | Extragalactic astronomy | |
| DOI | https://doi.org/10.1051/0004-6361/201936273 | |
| Published online | 04 September 2019 | |
The coronal temperature of NGC 4388 and NGC 2110 measured with INTEGRAL⋆
1
INAF-Osservatorio di astrofisica e scienza dello spazio di Bologna, Via Piero Gobetti 93/3, 40129 Bologna, Italy
e-mail: This email address is being protected from spambots. You need JavaScript enabled to view it.
2
INAF-Istituto di Astrofisica e Planetologia Spaziali, via Fosso del Cavaliere, 00133 Roma, Italy
3
School of Physics and Astronomy, University of Southampton, SO17 1BJ Southampton, UK
Received:
9
July
2019
Accepted:
2
August
2019
Abstract
Aims. We aim to measure the physical properties of the hot X-ray corona of two active galactic nuclei, NGC 4388 and NGC 2110.
Methods. We analysed the hard X-ray (20–300 keV) INTEGRAL spectrum in conjunction with archival XMM–Newton and NuSTAR data.
Results. The X-ray spectrum of both sources is phenomenologically well described by an absorbed cut-off power law. In agreement with previous results, we find no evidence of a Compton reflection component in these sources. We obtain a high-energy cut-off of 200−40+75 keV for NGC 4388 and 320−60+100 keV for NGC 2110. A fit with a thermal Comptonisation model yields a coronal temperature of 80−20+40 keV and 75−15+20 keV, respectively, and an optical depth of approximately two, assuming a spherical geometry. The coronal temperature and luminosity of both sources are consistent with pair production that acts as a thermostat for the thermal plasma. These results emphasise the importance of good signal-to-noise X-ray data above 100 keV to probe the high-energy emission of AGNs.
Key words: galaxies: active / galaxies: Seyfert / X-rays: galaxies / X-rays: individuals: NGC 4388 / X-rays: individuals: NGC 2110
The reduced spectra (FITS files) are only available at the CDS via anonymous ftp to cdsarc.u-strasbg.fr (130.79.128.5) or via http://cdsarc.u-strasbg.fr/viz-bin/qcat?J/A+A/629/A54
© ESO 2019
1. Introduction
One of the main components of active galactic nuclei (AGNs) is a hot corona, which is thought to produce the X-ray emission via thermal Comptonisation of optical and UV photons from the accretion disc. This process naturally explains the observed power-law shape of the X-ray spectra of AGNs and their high-energy cut-off, which is related to the coronal temperature. The cut-off has often been observed at ∼100 keV thanks to both past and current X-ray missions, such as the Compton Gamma-Ray Observatory’s Oriented Scintillation Spectrometer Experiment (OSSE; Zdziarski et al. 2000), BeppoSAX (Perola et al. 2002), Swift’s Burst Alert Telescope (BAT; Baumgartner et al. 2013; Ricci et al. 2017), INTEGRAL (Malizia et al. 2014), and NuSTAR (Fabian et al. 2015; Tortosa et al. 2018, and references therein). Good constraints on the high-energy cut-off have been, and are still, obtained for a number of AGNs with NuSTAR. This leads to measurements of the coronal temperature to range from 15–20 keV in the “coolest” sources (Kara et al. 2017; Tortosa et al. 2017; Buisson et al. 2018; Turner et al. 2018) to ∼400 keV in NGC 5506 (Matt et al. 2015). However, in many cases only lower limits to the cut-off have been reported (e.g. Kamraj et al. 2018) that can still be useful to constrain the geometrical and physical parameters of the hot corona (e.g. Matt et al. 2014; Marinucci et al. 2015; Ursini et al. 2015).
Thanks to its high-energy coverage, the Imager on-board INTEGRAL (IBIS; Ubertini et al. 2003) allows us to obtain good measurements of the cut-off energy (Panessa et al. 2008; Molina et al. 2009; de Rosa et al. 2012; Malizia et al. 2014) and of the coronal temperature (Lubiński et al. 2016). In this paper, we present the INTEGRAL’s IBIS spectrum together with archival XMM–Newton and NuSTAR observations of two of the brightest Seyfert galaxies in the hard X-rays: NGC 4388 and NGC 2110. In Sect. 2 we report the data selection and reduction. In Sect. 3 we report the spectral analysis. In Sect. 4 we discuss the results and summarise the conclusions. The main properties of the two sources are summarised below.
NGC 4388. NGC 4388 is a nearby (z = 0.00842, Lu et al. 1993), X-ray bright Seyfert galaxy, hosting a supermassive black hole of (8.5 ± 0.2)×106 M⊙ (measured from the water maser; see Kuo et al. 2011). This source has been observed by all of the major X-ray satellites. The hard X-ray spectrum is moderately absorbed by a column density of a few ×1023 cm−2, which is found to be variable on short time-scales (Elvis et al. 2004). The soft X-ray spectrum below ∼2 − 3 keV is dominated by emission of a hot plasma in an extended X-ray nebula at kpc scales (Matt et al. 1994; Iwasawa et al. 2003; Beckmann et al. 2004; Bianchi et al. 2006). No Compton reflection hump has been detected with NuSTAR (Kamraj et al. 2017) despite the presence of a strong Fe Kα emission line, that likely originates from Compton-thin material (Kamraj et al. 2017). Past results indicate the presence of a high-energy cut-off at ∼200 keV, albeit with some uncertainties (see Table 1). From INTEGRAL data taken in 2003 in combination with XMM–Newton spectra, Beckmann et al. (2004) reported a lower limit of 180 keV to the high-energy cut-off. The same result is obtained by de Rosa et al. (2012), also from INTEGRAL+XMM–Newton data. Using high-energy INTEGRAL and BAT data, Molina et al. (2013) report a high-energy cut-off of  keV. From INTEGRAL data taken from 2003 to 2009, Fedorova et al. (2011) report strong variations in both the flux and spectral slope in the 20–60 keV band on a few months time-scale. These authors also report a high-energy cut-off at ∼200 keV with some indications of variability between 80–100 keV and > 320 keV, but with limited statistics. From INTEGRAL data taken from 2003 to 2010, Lubiński et al. (2016) report a temperature of
  keV and an optical depth of
  . However, no constraint on the cut-off has been found with NuSTAR (Kamraj et al. 2017) and only a lower limit of ∼100 keV was reported from BeppoSAX (Risaliti 2002) and Swift’s BAT (Ricci et al. 2017). From the analysis of the 58-month Swift’s BAT light curves, Caballero-Garcia et al. (2012) report the detection of hard X-ray spectral variability in the 14–195 keV band. However, Soldi et al. (2014) do not find strong evidence of long-term hard X-ray spectral variability from BAT data up to 66 months.
Previous constraints on high-energy cut-off and coronal temperature (both in keV) reported in literature.
IBIS source significance of NGC 4388 and NGC 2110 in three energy bands: 100–120 keV, 120–150 keV, 150–300 keV.
NGC 2110. NGC 2110 is another nearby (z = 0.00779, Gallimore et al. 1999), X-ray bright Seyfert galaxy. Diniz et al. (2015) report a black hole mass of  , from the relation with the stellar velocity dispersion. From BeppoSAX data, Malaguti et al. (1999) found the X-ray spectrum to be affected by complex absorption. This has been later confirmed by Evans et al. (2007), who find the Chandra+XMM–Newton data to be well fitted with a neutral, three-zone, partial-covering absorber. Rivers et al. (2014) find the Suzaku data to be well fitted with a stable full-covering absorber plus a variable partial-covering absorber. A soft excess below 1.5 keV is also present (Evans et al. 2007), and possibly due to extended circumnuclear emission seen with Chandra (Evans et al. 2006). No Compton reflection hump has been detected with Suzaku (Rivers et al. 2014) or NuSTAR (Marinucci et al. 2015), despite the presence of a complex Fe Kα line. According to the multi-epoch analysis of Marinucci et al. (2015), the Fe Kα line is likely the sum of a constant component (from distant, Compton-thick material) and a variable one (from Compton-thin material). Concerning the high-energy cut-off, ambiguous results have been reported in literature (see Table 1). Ricci et al. (2017) report a value of
  keV, while Lubiński et al. (2016) report a coronal temperature of
  keV and an optical depth of
  . From 2008–2009 INTEGRAL data, Beckmann & Do Cao (2010) report a cut-off of ∼80 keV with a hard photon index, but these results are not confirmed by NuSTAR (Marinucci et al. 2015). Indeed, only lower limits to the high-energy cut-off have been found with NuSTAR (210 keV: Marinucci et al. 2015), Suzaku (250 keV: Rivers et al. 2014) and BeppoSAX (143 keV: Risaliti 2002). No hard X-ray spectral variability has been detected by Caballero-Garcia et al. (2012) and Soldi et al. (2014) from BAT data, despite the significant flux variability.
2. Data selection and reduction
For both sources, we collected the archival XMM–Newton and NuSTAR data to complement the IBIS spectrum (see Table 3). The XMM–Newton data were processed using the XMM–Newton Science Analysis System (SAS v18). We focused on the EPIC-pn data because of the much larger effective area compared with the MOS detectors. The source extraction radii and screening for high-background intervals were determined through an iterative process that maximises the signal-to-noise ratio (see Piconcelli et al. 2004). The background were extracted from circular regions with a radius of 50 arcsec, while the source extraction radii were in the range 20–40 arcsec. The spectra were binned to have at least 30 counts per spectral bin and not oversampling the instrumental resolution by a factor larger than 3.
Low-energy X-ray data of NGC 4388 and NGC 2110 analysed in this work.
The NuSTAR data were reduced using the standard pipeline (NUPIPELINE) in the NuSTAR Data Analysis Software (NUSTARDAS, v1.8.0), using calibration files from NuSTAR CALDB v20190410. We extracted the spectra using the standard tool NUPRODUCTS for each of the two hard X-ray detectors, which reside in the corresponding focal plane modules A and B (FPMA and FPMB). We extracted the source data from circular regions with a radius of 75 arcsec, and the background from a blank area close to the source. The spectra were binned to have a signal-to-noise ratio larger than 3 in each spectral channel and not to oversample the instrumental resolution by a factor greater than 2.5. The spectra from the two detectors were analysed jointly but not combined.
Both NGC 4388 and NGC 2110 are detected with a good signal-to-noise in the hard X-ray band with IBIS (> 6σ in the 150–300 keV band, see Table 2). Here we use the data collected by the INTEGRAL Soft Gamma-Ray Imager (ISGRI: Lebrun et al. 2003), that is the low-energy camera of the IBIS telescope. We used data up to INTEGRAL orbit 1500, that is from the launch in 2002 to the end of January 2015. ISGRI images for each available pointing were generated in 14 energy bands using the ISDC offline scientific analysis (OSA) software (Goldwurm et al. 2003), version 10.2. Count rates at the position of the source were extracted from individual images to provide light curves in 14 energy bands between 20 and 300 keV. Weighted mean fluxes were then extracted in each band and combined to produce an average source spectrum (see Bird et al. 2007, 2010, for details). Corresponding weighted response (arf) files for each source were created by weighting the published matrices for each response validity period according to the photon fluence from the source during that validity period. This method takes into account both the different exposure in each validity period, and any source variability present. A single rmf response is used, corresponding to the standard rmf, rebinned according to the 14 channels used for spectral analysis. For NGC 4388, the spectrum was derived from 4770 pointings with a total on-source time (not adjusted for off-axis response) of 7.5 Ms. The corresponding figures for NGC 2110 are 2249 pointings for 3.8 Ms total on-source time. In both cases, the observations are spread reasonably uniformly across the time period analysed.
3. Spectral analysis
Spectral analysis and model fitting was carried out with the XSPEC 12.10 package (Arnaud et al. 1996), using the χ2 minimisation technique. Errors are quoted at the 90 per cent confidence level for one interesting parameter. We assumed the element abundances of Anders & Grevesse (1989) and the photoelectric absorption cross-sections of Verner et al. (1996). We fitted the IBIS spectra over the full 20–300 keV energy band.
3.1. NGC 4388
The emission of this source below ∼3 keV is known to be dominated by emission from a hot plasma in an extended X-ray nebula at kpc scales (Beckmann et al. 2004). Therefore, since our main focus is the AGN-dominated hard X-ray emission, we restricted the broad-band spectral analysis to the data above 4 keV. We fitted the XMM–Newton and NuSTAR spectra over the 4–10 keV and 4–79 keV energy bands, respectively.
3.1.1. The IBIS spectrum
As a first step, we focused on the IBIS spectrum, with a twofold purpose: first, testing for the presence of a curvature at high energies and, secondly, a consistency check with the low-energy spectra. We performed fits assuming absorption by a column density NH = 2.7 × 1023 cm−2 (Beckmann et al. 2004) since this value is not constrained by the data above 20 keV.
Fitting the IBIS data with a power law, we obtain a poor fit (χ2/d.o.f. = 17/10) with negative residuals above 100 keV (Fig. 1, first panel). To reproduce this curvature, we first tried to include Compton reflection, replacing the cut-off power law with PEXRAV (Magdziarz & Zdziarski 1995). This model includes Compton reflection off a neutral slab of infinite column density. We fixed the inclination angle at 60 deg since the fit was not sensitive to this parameter. We first fixed the reflection fraction (ℛ = Ω/2π, where Ω is the solid angle subtended by the reflector) at 0.5. The model also includes an exponential high-energy cut-off, which we left free to vary. This yields a slightly better fit (χ2/d.o.f. = 14/9), but still with the indication of a curvature (Fig. 1, second panel). Indeed, leaving ℛ free to vary, the value is pegged at zero with an upper limit of 0.3. Then, we replaced PEXRAV with a cut-off power law (equivalent to PEXRAV with ℛ = 0) finding a good fit (χ2/d.o.f. = 8/9) and a cut-off energy of  keV. Finally, we replaced the phenomenological cut-off power law with the Comptonisation model COMPPS (Poutanen & Svensson 1996). We obtain a good fit (χ2/d.o.f. = 7/9) and a temperature of
  keV. We also repeated the same analysis assuming the partial-covering absorption with NH = 6.5 × 1023 cm−2 and a covering factor of 0.9, consistent with NuSTAR data (Kamraj et al. 2017), obtaining analogous results. Then we extrapolated the best-fitting cut-off power law down to 4 keV, without re-fitting, to compare it with the XMM–Newton and NuSTAR spectra (Fig. 2). Despite the flux variability, the XMM1, XMM2, and NUS spectral shape appears in good agreement with the extrapolation, with minor discrepancies likely due to an imperfect modelling of absorption. XMM3 instead shows a significant difference in spectral shape.
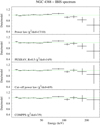 |
Fig. 1. Residuals of fits of IBIS spectrum with different models. Upper panel: simple power law. Second panel: power law plus reflection (PEXRAV). Third panel: exponentially cut-off power law. Lower panel: thermal Comptonisation model (COMPPS). |
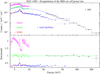 |
Fig. 2. Upper panel: XMM–Newton and NuSTAR spectra of NGC 4388 with the cut-off power law that best fits IBIS. Lower panel: data/model ratio. Only NuSTAR’s FPMA data are shown for clarity. The data were binned for plotting purposes. |
3.1.2. The broad-band fit
As a second step, we performed a broad-band fit including the lower energy data from XMM–Newton and NuSTAR. We used the XMM1, XMM2, and NUS spectra, that is to say those in good agreement with IBIS. XMM3, despite having the deepest exposure, likely represents a different spectral state compared with the average and is discussed in Appendix A.
First, we fitted the data with a phenomenological model. Following Kamraj et al. (2017), we used a model consisting of a cut-off power law plus a Gaussian Fe Kα line, modified by partial covering absorption. The model reads PCFABS(CUTOFFPL+ZGAUSS) in XSPEC terminology. We included a cross-normalisation constant free to vary among the XMM1, XMM2, and NUS observations, to account for the flux variations. We first assumed all the other parameters to be constant, meaning that they were tied among the different spectra. We obtained a good fit (χ2/d.o.f. = 455/435), but with some residuals near 6.4 keV indicating variability of the iron line flux not related to the primary continuum. We thus left the normalisation of the Gaussian line free to vary among the different spectra. We obtained an excellent fit (χ2/d.o.f. = 433/432), with Γ ≃ 1.6 and a well constrained cut-off energy of  keV. We found no significant improvement by leaving the column density NH, the covering factor CF, or the photon index free to vary among the different observations. The best-fitting parameters are reported in Table 4, while the contour plots of the cut-off energy and photon index are shown in Fig. 3. We also tried to include a reflection component, replacing the cut-off power law with PEXRAV and leaving the reflection fraction ℛ free and tied among the observations. The fit is not improved and we obtain only an upper limit ℛ < 0.12. We note that the large equivalent width of the Fe Kα line is consistent with that reported by Kamraj et al. (2017), who suggest the presence of a large amount of Compton-thin line-emitting material.
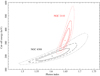 |
Fig. 3. Contour plots of cut-off energy vs. photon index for NGC 4388 (black) and NGC 2110 (red). Solid, dashed, and dotted lines correspond to 68, 90, and 99 per cent confidence level, respectively. |
Best-fitting parameters for NGC 4388. (t) denotes a parameters tied between the spectra.
Then, we fitted the data using a more physical Comptonisation model. We replaced the cut-off power law with COMPPS, assuming a spherical geometry (GEOM = 0). We assumed a seed photon temperature of 100 eV. Fixing this parameter at other values, like 10 eV, does not alter the results significantly. We fitted for the electron temperature kTe and the Compton parameter y = 4τ(kTe/mec2). We chose to use the Compton parameter instead of the optical depth to minimise the model degeneracy since the temperature and optical depth are generally correlated in the fitting procedure (e.g. Petrucci et al. 2001, 2013).
We obtained a very good fit (χ2/d.o.f. = 444/432), with  keV and
  , corresponding to an optical depth τ = 1.7 ± 0.7. The best-fitting parameters (kTe, y, and normalisation) are reported in Table 4, while the kTe − y contour plots are shown in Fig. 4. The cross-normalisations, absorption and iron line parameters are consistent within the errors with the cut-off power law fit.
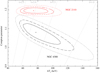 |
Fig. 4. Contour plots of Compton parameter y vs. electron temperature kTe for NGC 4388 (black) and NGC 2110 (red). Solid, dashed, and dotted lines correspond to 68, 90, and 99 per cent confidence level, respectively. Grey dotted lines correspond to constant values of optical depth. |
3.2. NGC 2110
The soft X-ray emission of NGC 2110 below ∼2 − 3 keV is affected by variable absorption from a complex medium (Evans et al. 2007; Rivers et al. 2014). Therefore, we restricted the spectral analysis to the data above 3 keV. We fitted the XMM–Newton and NuSTAR spectra over the 3–10 keV and 3–79 keV energy bands.
3.2.1. The IBIS spectrum
As we did for NGC 4388, we first focused on the IBIS spectrum. The spectrum above 20 keV is not strongly altered by absorption, however we assumed NH = 4 × 1022 cm−2 (Marinucci et al. 2015).
Fitting the data with a power law, we obtained a statistically good fit (χ2/d.o.f. = 9/10) with a hint of a curvature above 120 keV (Fig. 6, first panel). We also tested three other models, as done for NGC 4388, namely: PEXRAV with ℛ = 0.5, a cut-off power law and COMPPS. We obtained the same improvement in terms of χ2 for all the three models (χ2/d.o.f. = 5/9; see Fig. 6). Finally, we extrapolated the best-fitting cut-off power law down to 3 keV and compared it with the XMM–Newton and NuSTAR spectra (Fig. 7). Despite the significant flux variability in the 3–79 keV band, there is no strong evidence of significant spectral variability among the different observations.
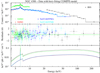 |
Fig. 5. Upper panel: spectra of NGC 4388 with best-fitting COMPPS model. Second panel: residuals, plotted as Δχ = (data-model)/error. Third panel: best-fitting model E2f(E). The data were binned for plotting purposes. |
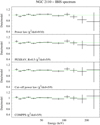 |
Fig. 6. Residuals of fits of IBIS spectrum with different models. Upper panel: simple power law. Second panel: power law plus reflection (PEXRAV). Third panel: exponentially cut-off power law. Lower panel: thermal Comptonisation model (COMPPS). |
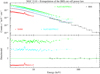 |
Fig. 7. Upper panel: XMM–Newton and NuSTAR spectra of NGC 2110 with the cut-off power law that best fits IBIS. Lower panel: data/model ratio. Only NuSTAR’s FPMA data are shown for clarity. The data were binned for plotting purposes. |
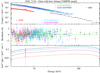 |
Fig. 8. Upper panel: spectra of NGC 2110 with best-fitting COMPPS model. Second panel: residuals, plotted as Δχ = (data-model)/error. Third panel: best-fitting model E2f(E). The data were binned for plotting purposes. |
3.2.2. The broad-band fit
Next, we included the XMM–Newton and NuSTAR data. We first fitted the data with a phenomenological model consisting of an absorbed cut-off power law plus a Gaussian Fe Kα line. In XSPEC, the model reads PHABS(CUTOFFPL+ZGAUSS). According to the results of Marinucci et al. (2015), the flux of the iron line varies among the XMM–Newton and the two NuSTAR observations, while the values of the line energy and intrinsic width are consistent with each other within the errors. We thus left the line flux free to vary among the observations, while the intrinsic width was tied. Keeping all the other parameters tied among the different spectra, we found a good fit (χ2/d.o.f. = 975/1009). However, we found an improvement by leaving the absorbing column density free to vary among the spectra, finally obtaining χ2/d.o.f. = 947/1007 (Δχ2/Δd.o.f. = −28/ − 2; the probability of chance improvement is 4 × 10⁻⁷ from an F-test), with Γ ≃ 1.65 and a  keV. No significant improvement is found by leaving the photon index free to vary, and the cut-off energy is consistent with the value reported above. The best-fitting parameters are reported in Table 5, while the contour plots of the cut-off energy and photon index are shown in Fig. 3. To check for the presence of a reflection component, we replaced the cut-off power law with PEXRAV, leaving the reflection fraction ℛ free and tied among the observations. The fit is not improved and we obtain a stringent upper limit ℛ < 0.02.
Best-fitting parameters for NGC 2110. (t) denotes a parameters tied between the spectra.
Then, we replaced the cut-off power law with COMPPS, assuming a spherical geometry and a seed photon temperature of 100 eV. We obtained a good fit (χ2/d.o.f. = 971/1007), with  keV and
  , corresponding to an optical depth τ = 2.1 ± 0.5. The best-fitting parameters are reported in Table 5, while the kTe − y contour plots are shown in Fig. 4.
4. Discussion and conclusions
We presented the hard X-ray spectra of the two X-ray bright Seyferts NGC 4388 and NGC 2110, from INTEGRAL’s IBIS data taken from 2003 to early 2015. From a joint fit with XMM–Newton and NuSTAR data, we find that the spectrum up to 300 keV is in both cases well described by an absorbed power law with a well-constrained high-energy cut-off. In agreement with past observations, we find no evidence of a Compton hump. The primary continuum is generally consistent with being constant in spectral slope among the time-averaged IBIS spectrum and the XMM–Newton and NuSTAR observations, with some absorption variability seen in NGC 2110. This is consistent with the lack of clear evidence of strong hard X-ray spectral variability in these objects (Soldi et al. 2014). The exception is the 2011 XMM–Newton observation of NGC 4388, which has a flatter and less obscured spectrum (see Appendix A). On the other hand, the cross-normalisation constants indicate a significant flux variability in the XMM–Newton and NuSTAR energy bands, up to a factor of approximately eight in NGC 2110.
Fitting the data with a phenomenological cut-off power law, we obtain photon indices of  for NGC 4388 and of 1.65 ± 0.02 for NGC 2110, both perfectly consistent with the values previously reported from NuSTAR data alone (Kamraj et al. 2017; Marinucci et al. 2015). As for the cut-off energies, we obtain
  keV for NGC 4388 and
  keV for NGC 2110; the latter measurement is consistent with the lower limit of ∼200 keV previously reported from Suzaku and NuSTAR data (Rivers et al. 2014; Marinucci et al. 2015). Both values are also consistent within the errors with those reported by Ricci et al. (2017). In the case of NGC 4388, the measurement is consistent with previous INTEGRAL results (Fedorova et al. 2011; Molina et al. 2013). However, the IBIS spectrum analysed here shows a clear and unambiguous high-energy turnover, not related to a putative reflection hump which could affect the results (Molina et al. 2013). The cut-off energies of the two sources are relatively high compared with both the INTEGRAL high-energy cut-off distribution reported by Malizia et al. (2014), which has a mean of 128 keV with a spread of 46 keV, and with the values recently measured with NuSTAR (Tortosa et al. 2018; Lanzuisi et al. 2019). Among the 19 bright sources observed by NuSTAR and discussed by Tortosa et al. (2018), only two have a cut-off > 200 keV and a coronal temperature > 70 keV with a percent error ≲50%.
From a fit with a thermal Comptonisation model and assuming a spherical geometry, we obtain in both cases a coronal temperature of 70–80 keV and an optical depth close to two. In the case of NGC 4388, the temperature of  keV is consistent within the errors with the upper limit of 70 keV reported by Lubiński et al. (2016), who use the same model (i.e. COMPPS with spherical geometry). In the case of NGC 2110, instead, the temperature of
  keV is much lower than the value reported by Lubiński et al. (2016), who find a lower limit of 160 keV. However, Lubiński et al. (2016) also report a relatively large reflection fraction of ∼0.6, which is not consistent with the NuSTAR and Suzaku constraints (as already noted by Lubiński et al. 2016, Sect. 5.1.3). We verified that imposing ℛ = 0.6 we obtain a temperature of ∼340 keV, but with a worse fit (Δχ2 = +12; F-test probability of 4.4 × 10⁻⁴). Lubiński et al. (2016) also note that the discrepancy could be due to the use of INTEGRAL data up to 2010 only, and that adding more recent INTEGRAL data result in a lower value of ℛ. Our results are roughly consistent with the temperature being a factor of two or three smaller than the cut-off energy, depending on the optical depth (Petrucci et al. 2000, 2001). The difference is actually by a factor of four in NGC 2110, but since the high-energy turnover of a Comptonisation spectrum is much sharper than an exponential cut-off (e.g. Stern et al. 1995; Zdziarski et al. 2003; Niedźwiecki et al. 2019), this difference should not be overinterpreted (Petrucci et al. 2001).
In both sources, the Fe Kα emission line is not accompanied by a significant Compton reflection hump, suggesting that the line originates from Compton-thin material, such as the broad-line region (Kamraj et al. 2017; Marinucci et al. 2015) or a Compton-thin torus (Baloković et al. 2018). The lack of a Compton hump due to reflection off the accretion disc or an optically thick torus could also indicate that the X-ray corona does not effectively illuminate this surrounding matter. This could be a geometrical effect, if the disc and the torus subtend a small solid angle from the corona. Alternatively, the X-ray coronal emission could be anisotropic (Beckmann et al. 2004; Kamraj et al. 2017). For example, if the X-ray corona is outflowing at relativistic velocities, its emission would be beamed away from the disc, possibly producing a weaker reflection component (Malzac et al. 2001).
The 2–10 keV luminosity extrapolated from the IBIS time-averaged spectrum is (1.3 ± 0.1)×1043 ergs s−1 for NGC 4388 and (1.33 ± 0.03)×1043 ergs s−1 for NGC 2110, respectively. Using the bolometric correction of Marconi et al. (2004), we estimate a bolometric luminosity of ∼2.5 × 1044 ergs s−1 for both sources. Given the different black hole mass, this yields a different accretion rate in Eddington units, of ∼0.23 for NGC 4388 and ∼0.01 for NGC 2110. The latter is in agreement with the estimate reported by Marinucci et al. (2015), with the caveat that the estimate of black hole mass in NGC 2110 has a large uncertainty.
The X-ray corona of AGNs can produce radio synchrotron emission (Raginski & Laor 2016), as recently observed in the two bright Seyferts IC 4329A and NGC 985 (Inoue & Doi 2018). This could explain the radio emission seen in radio-quiet Seyferts, whose origin is under debate (Panessa et al. 2019, and references therein). In general, a coronal origin for the radio emission is suggested by the observed relation between the radio luminosity at 5 GHz LR and the X-ray (0.2–20 keV) luminosity LX, with LR/LX = 10−5 like in coronally active stars (Laor & Behar 2008). Another hint is the presence of a mm-wave excess with respect to the spectral slope extrapolated from low frequencies (Behar et al. 2015, 2018). NGC 4388 has a complex radio structure (Falcke et al. 1998; Mundell et al. 2000), with a faint core having a flux density of 1.3 mJy at 1.6 GHz and < 0.55 mJy at 5 GHz (Giroletti & Panessa 2009). This source exhibits a mm excess (Behar et al. 2018), but it also has a LR/LX ratio < 10−7 (from the upper limit to the 5 GHz luminosity reported by Giroletti & Panessa 2009). NGC 2110 shows an S-shaped jet-counterjet radio structure, with a relatively bright core having a flux density of 100 mJy at 5 GHz (Ulvestad & Wilson 1983; Mundell et al. 2000). Beckmann & Do Cao (2010) argue that this object is borderline between a radio-quiet Seyfert and a radio-loud galaxy with a Fanaroff & Riley (1974) type I morphology. No mm excess is found in NGC 2110, whose radio and mm emission is consistent with originating from the jet (Behar et al. 2018). We conclude that the radio emission is unlikely to be of coronal origin in the two sources discussed here. According to our results, NGC 4388 and NGC 2110 have a corona with similar physical parameters and producing the same X-ray luminosity. However, they seem to have different accretion/ejection parameters: while NGC 4388 has a high Eddington ratio and a weak radio core, NGC 2110 has a relatively low Eddington ratio and a bright radio core. This is consistent with the inverse relation between radio loudness and Eddington ratio, found both in radio-quiet and radio-loud objects (Ho 2002; Sikora et al. 2007; Panessa et al. 2007). The physical origin of this anticorrelation is a matter of debate (Broderick & Fender 2011; Beckmann & Shrader 2012).
Finally, we put NGC 4388 and NGC 2110 in the compactness-temperature (ℓ − Θe) diagram (Fabian et al. 2015) by calculating the dimensionless coronal temperature Θe = kTe/mec2 and the compactness parameter ℓ = LσT/Rmec3, where L is the luminosity and R is the radius of the corona. Following Fabian et al. (2015), we used the luminosity of the primary continuum extrapolated to the 0.1–200 keV band. For both sources we assumed the flux level of the IBIS spectra. Denoting by R10 the coronal size in units of 10 gravitational radii, we obtained ℓ ≃ 130 (R10)−1 and  for NGC 4388, while for NGC 2110 we obtained ℓ ≃ 5 (R10)−1 and
  . Then, assuming a radius of 10 gravitational radii, both sources would lie below the pair runaway line, that is a maximum-luminosity curve delimiting a forbidden region in which pair production would exceed annihilation (Fabian et al. 2015). Our results are thus in agreement with a scenario in which the so-called pair thermostat (e.g. Svensson 1984; Zdziarski 1985) controls the coronal temperature in AGNs (Fabian et al. 2015), possibly with a contribution from non-thermal particles (Fabian et al. 2017). The compactness estimated for NGC 2110 is not very high, but given the uncertainty on the black hole mass (and on the coronal size), it could easily be > 10. Interestingly, for a pair-dominated corona, the spectral shape is almost constant unless the luminosity variations are strong (e.g. by a factor of 20: see Haardt et al. 1997).
We note that the detection of a high-energy roll-over in the two sources discussed above is enabled by a broad-band energy coverage, extending up to 300 keV thanks to the unique capabilities of IBIS. These results demonstrate that spectral information above 100 keV is crucial to constrain the properties of the hot corona in AGNs, especially in the high-temperature regime. Extending the census of AGN coronal parameters is in turn essential to test the pair thermostat scenario and to search for correlations between the different coronal parameters, that may carry significant information on the disc/corona system (Tortosa et al. 2018; Middei et al. 2019). Future high-energy missions like HEX-P (Madsen et al. 2018) and ASTENA (Fuschino et al. 2018) will be key to provide single-epoch measurements of the high-energy cut-off.
Acknowledgments
We thank the referee for comments that improved the manuscript. We acknowledge financial support from ASI and INAF under INTEGRAL “accordo ASI/INAF 2013-025-R1”.
References
- Anders, E., & Grevesse, N. 1989, Geochim. Cosmochim. Acta, 53, 197 [Google Scholar]
- Arnaud, K. A. 1996, in Astronomical Data Analysis Software and Systems V, eds. G. H. Jacoby, & J. Barnes, ASP Conf. Ser., 101, 17 [NASA ADS] [Google Scholar]
- Baloković, M., Brightman, M., Harrison, F. A., et al. 2018, ApJ, 854, 42 [NASA ADS] [CrossRef] [Google Scholar]
- Baumgartner, W. H., Tueller, J., Markwardt, C. B., et al. 2013, ApJS, 207, 19 [NASA ADS] [CrossRef] [EDP Sciences] [Google Scholar]
- Beckmann, V., & Do Cao, O. 2010, Eighth Integral Workshop. The Restless Gamma-ray Universe (INTEGRAL 2010), 81 [Google Scholar]
- Beckmann, V., & Shrader, C. R. 2012, Active Galactic Nuclei (Weinheim, Germany: Wiley-VCH) [CrossRef] [Google Scholar]
- Beckmann, V., Gehrels, N., Favre, P., et al. 2004, ApJ, 614, 641 [NASA ADS] [CrossRef] [Google Scholar]
- Behar, E., Baldi, R. D., Laor, A., et al. 2015, MNRAS, 451, 517 [NASA ADS] [CrossRef] [Google Scholar]
- Behar, E., Vogel, S., Baldi, R. D., Smith, K. L., & Mushotzky, R. F. 2018, MNRAS, 478, 399 [NASA ADS] [CrossRef] [Google Scholar]
- Bianchi, S., Matt, G., Nicastro, F., Porquet, D., & Dubau, J. 2005, MNRAS, 357, 599 [NASA ADS] [CrossRef] [Google Scholar]
- Bianchi, S., Guainazzi, M., & Chiaberge, M. 2006, A&A, 448, 499 [NASA ADS] [CrossRef] [EDP Sciences] [Google Scholar]
- Bird, A. J., Malizia, A., Bazzano, A., et al. 2007, ApJS, 170, 175 [NASA ADS] [CrossRef] [Google Scholar]
- Bird, A. J., Bazzano, A., Bassani, L., et al. 2010, ApJS, 186, 1 [NASA ADS] [CrossRef] [Google Scholar]
- Broderick, J. W., & Fender, R. P. 2011, MNRAS, 417, 184 [NASA ADS] [CrossRef] [Google Scholar]
- Buisson, D. J. K., Fabian, A. C., & Lohfink, A. M. 2018, MNRAS, 481, 4419 [NASA ADS] [CrossRef] [Google Scholar]
- Caballero-Garcia, M. D., Papadakis, I. E., Nicastro, F., & Ajello, M. 2012, A&A, 537, A87 [NASA ADS] [CrossRef] [EDP Sciences] [Google Scholar]
- de Rosa, A., Panessa, F., Bassani, L., et al. 2012, MNRAS, 420, 2087 [NASA ADS] [CrossRef] [Google Scholar]
- Diniz, M. R., Riffel, R. A., Storchi-Bergmann, T., & Winge, C. 2015, MNRAS, 453, 1727 [NASA ADS] [CrossRef] [Google Scholar]
- Elvis, M., Risaliti, G., Nicastro, F., et al. 2004, ApJ, 615, L25 [NASA ADS] [CrossRef] [Google Scholar]
- Evans, D. A., Lee, J. C., Kamenetska, M., et al. 2006, ApJ, 653, 1121 [NASA ADS] [CrossRef] [Google Scholar]
- Evans, D. A., Lee, J. C., Turner, T. J., Weaver, K. A., & Marshall, H. L. 2007, ApJ, 671, 1345 [NASA ADS] [CrossRef] [Google Scholar]
- Fabian, A. C., Lohfink, A., Kara, E., et al. 2015, MNRAS, 451, 4375 [NASA ADS] [CrossRef] [Google Scholar]
- Fabian, A. C., Lohfink, A., Belmont, R., Malzac, J., & Coppi, P. 2017, MNRAS, 467, 2566 [NASA ADS] [CrossRef] [Google Scholar]
- Falcke, H., Wilson, A. S., & Simpson, C. 1998, Apj, 502, 199 [NASA ADS] [CrossRef] [Google Scholar]
- Fanaroff, B. L., & Riley, J. M. 1974, MNRAS, 167, 31P [Google Scholar]
- Fedorova, E. V., Beckmann, V., Neronov, A., & Soldi, S. 2011, MNRAS, 417, 1140 [NASA ADS] [CrossRef] [Google Scholar]
- Fuschino, F., Campana, R., Caroli, E., et al. 2018, in Space Telescopes and Instrumentation 2018: Ultraviolet to Gamma Ray, SPIE Conf. Ser., 10699, 106995Z [Google Scholar]
- Gallimore, J. F., Baum, S. A., O’Dea, C. P., Pedlar, A., & Brinks, E. 1999, ApJ, 524, 684 [NASA ADS] [CrossRef] [Google Scholar]
- Giroletti, M., & Panessa, F. 2009, ApJ, 706, L260 [NASA ADS] [CrossRef] [Google Scholar]
- Goldwurm, A., David, P., Foschini, L., et al. 2003, A&A, 411, L223 [NASA ADS] [CrossRef] [EDP Sciences] [Google Scholar]
- Haardt, F., Maraschi, L., & Ghisellini, G. 1997, ApJ, 476, 620 [NASA ADS] [CrossRef] [Google Scholar]
- Ho, L. C. 2002, ApJ, 564, 120 [NASA ADS] [CrossRef] [Google Scholar]
- Inoue, Y., & Doi, A. 2018, ApJ, 869, 114 [NASA ADS] [CrossRef] [Google Scholar]
- Iwasawa, K., Wilson, A. S., Fabian, A. C., & Young, A. J. 2003, MNRAS, 345, 369 [NASA ADS] [CrossRef] [Google Scholar]
- Kamraj, N., Rivers, E., Harrison, F. A., Brightman, M., & Baloković, M. 2017, ApJ, 843, 89 [NASA ADS] [CrossRef] [Google Scholar]
- Kamraj, N., Harrison, F. A., Baloković, M., Lohfink, A., & Brightman, M. 2018, ApJ, 866, 124 [NASA ADS] [CrossRef] [Google Scholar]
- Kara, E., García, J. A., Lohfink, A., et al. 2017, MNRAS, 468, 3489 [NASA ADS] [CrossRef] [EDP Sciences] [Google Scholar]
- Kuo, C. Y., Braatz, J. A., Condon, J. J., et al. 2011, ApJ, 727, 20 [NASA ADS] [CrossRef] [Google Scholar]
- Lanzuisi, G., Gilli, R., Cappi, M., et al. 2019, ApJ, 875, L20 [NASA ADS] [CrossRef] [Google Scholar]
- Laor, A., & Behar, E. 2008, MNRAS, 390, 847 [NASA ADS] [CrossRef] [Google Scholar]
- Lebrun, F., Leray, J. P., Lavocat, P., et al. 2003, A&A, 411, L141 [NASA ADS] [CrossRef] [EDP Sciences] [Google Scholar]
- Lu, N. Y., Hoffman, G. L., Groff, T., Roos, T., & Lamphier, C. 1993, ApJS, 88, 383 [NASA ADS] [CrossRef] [Google Scholar]
- Lubiński, P., Beckmann, V., Gibaud, L., et al. 2016, MNRAS, 458, 2454 [NASA ADS] [CrossRef] [Google Scholar]
- Madsen, K. K., Harrison, F., Broadway, D., et al. 2018, in Space Telescopes and Instrumentation 2018: Ultraviolet to Gamma Ray, SPIE Conf. Ser., 10699, 106996M [Google Scholar]
- Magdziarz, P., & Zdziarski, A. A. 1995, MNRAS, 273, 837 [NASA ADS] [CrossRef] [Google Scholar]
- Malaguti, G., Bassani, L., Cappi, M., et al. 1999, A&A, 342, L41 [NASA ADS] [Google Scholar]
- Malizia, A., Molina, M., Bassani, L., et al. 2014, ApJ, 782, L25 [NASA ADS] [CrossRef] [Google Scholar]
- Malzac, J., Beloborodov, A. M., & Poutanen, J. 2001, MNRAS, 326, 417 [NASA ADS] [CrossRef] [Google Scholar]
- Marconi, A., Risaliti, G., Gilli, R., et al. 2004, MNRAS, 351, 169 [NASA ADS] [CrossRef] [Google Scholar]
- Marinucci, A., Matt, G., Bianchi, S., et al. 2015, MNRAS, 447, 160 [NASA ADS] [CrossRef] [Google Scholar]
- Matt, G., Piro, L., Antonelli, L. A., et al. 1994, A&A, 292, L13 [NASA ADS] [Google Scholar]
- Matt, G., Marinucci, A., Guainazzi, M., et al. 2014, MNRAS, 439, 3016 [NASA ADS] [CrossRef] [Google Scholar]
- Matt, G., Baloković, M., Marinucci, A., et al. 2015, MNRAS, 447, 3029 [NASA ADS] [CrossRef] [Google Scholar]
- Middei, R., Bianchi, S., Petrucci, P. O., et al. 2019, MNRAS, 483, 4695 [NASA ADS] [CrossRef] [Google Scholar]
- Molina, M., Bassani, L., Malizia, A., et al. 2009, MNRAS, 399, 1293 [NASA ADS] [CrossRef] [Google Scholar]
- Molina, M., Bassani, L., Malizia, A., et al. 2013, MNRAS, 433, 1687 [NASA ADS] [CrossRef] [Google Scholar]
- Mundell, C. G., Wilson, A. S., Ulvestad, J. S., & Roy, A. L. 2000, ApJ, 529, 816 [NASA ADS] [CrossRef] [Google Scholar]
- Niedźwiecki, A., Szanecki, M., & Zdziarski, A. A. 2019, MNRAS, 485, 2942 [NASA ADS] [CrossRef] [Google Scholar]
- Panessa, F., Barcons, X., Bassani, L., et al. 2007, A&A, 467, 519 [NASA ADS] [CrossRef] [EDP Sciences] [Google Scholar]
- Panessa, F., Bassani, L., de Rosa, A., et al. 2008, A&A, 483, 151 [NASA ADS] [CrossRef] [EDP Sciences] [Google Scholar]
- Panessa, F., Baldi, R. D., Laor, A., et al. 2019, Nat. Astron., 3, 387 [NASA ADS] [CrossRef] [Google Scholar]
- Perola, G. C., Matt, G., Cappi, M., et al. 2002, A&A, 389, 802 [NASA ADS] [CrossRef] [EDP Sciences] [Google Scholar]
- Petrucci, P. O., Haardt, F., Maraschi, L., et al. 2000, ApJ, 540, 131 [NASA ADS] [CrossRef] [Google Scholar]
- Petrucci, P. O., Haardt, F., Maraschi, L., et al. 2001, ApJ, 556, 716 [NASA ADS] [CrossRef] [Google Scholar]
- Petrucci, P.-O., Paltani, S., Malzac, J., et al. 2013, A&A, 549, A73 [NASA ADS] [CrossRef] [EDP Sciences] [Google Scholar]
- Piconcelli, E., Jimenez-Bailón, E., Guainazzi, M., et al. 2004, MNRAS, 351, 161 [NASA ADS] [CrossRef] [Google Scholar]
- Poutanen, J., & Svensson, R. 1996, ApJ, 470, 249 [NASA ADS] [CrossRef] [Google Scholar]
- Raginski, I., & Laor, A. 2016, MNRAS, 459, 2082 [NASA ADS] [CrossRef] [Google Scholar]
- Reeves, J. N., Nandra, K., George, I. M., et al. 2004, ApJ, 602, 648 [NASA ADS] [CrossRef] [Google Scholar]
- Ricci, C., Trakhtenbrot, B., Koss, M. J., et al. 2017, ApJS, 233, 17 [NASA ADS] [CrossRef] [Google Scholar]
- Risaliti, G. 2002, A&A, 386, 379 [NASA ADS] [CrossRef] [EDP Sciences] [Google Scholar]
- Rivers, E., Markowitz, A., Rothschild, R., et al. 2014, ApJ, 786, 126 [NASA ADS] [CrossRef] [Google Scholar]
- Sikora, M., Stawarz, Ł., & Lasota, J.-P. 2007, ApJ, 658, 815 [NASA ADS] [CrossRef] [Google Scholar]
- Soldi, S., Beckmann, V., Baumgartner, W. H., et al. 2014, A&A, 563, A57 [NASA ADS] [CrossRef] [EDP Sciences] [Google Scholar]
- Stern, B. E., Poutanen, J., Svensson, R., Sikora, M., & Begelman, M. C. 1995, ApJ, 449, L13 [NASA ADS] [CrossRef] [Google Scholar]
- Svensson, R. 1984, MNRAS, 209, 175 [NASA ADS] [CrossRef] [Google Scholar]
- Tombesi, F., Cappi, M., Reeves, J. N., et al. 2010, A&A, 521, A57 [NASA ADS] [CrossRef] [EDP Sciences] [Google Scholar]
- Tortosa, A., Marinucci, A., Matt, G., et al. 2017, MNRAS, 466, 4193 [NASA ADS] [Google Scholar]
- Tortosa, A., Bianchi, S., Marinucci, A., Matt, G., & Petrucci, P. O. 2018, A&A, 614, A37 [NASA ADS] [CrossRef] [EDP Sciences] [Google Scholar]
- Turner, T. J., Reeves, J. N., Braito, V., & Costa, M. 2018, MNRAS, 476, 1258 [NASA ADS] [CrossRef] [Google Scholar]
- Ubertini, P., Lebrun, F., Di Cocco, G., et al. 2003, A&A, 411, L131 [NASA ADS] [CrossRef] [EDP Sciences] [Google Scholar]
- Ulvestad, J. S., & Wilson, A. S. 1983, ApJ, 264, L7 [NASA ADS] [CrossRef] [Google Scholar]
- Ursini, F., Marinucci, A., Matt, G., et al. 2015, MNRAS, 452, 3266 [NASA ADS] [CrossRef] [Google Scholar]
- Verner, D. A., Ferland, G. J., Korista, K. T., & Yakovlev, D. G. 1996, ApJ, 465, 487 [NASA ADS] [CrossRef] [Google Scholar]
- Zdziarski, A. A. 1985, ApJ, 289, 514 [NASA ADS] [CrossRef] [Google Scholar]
- Zdziarski, A. A., Poutanen, J., & Johnson, W. N. 2000, ApJ, 542, 703 [NASA ADS] [CrossRef] [Google Scholar]
- Zdziarski, A. A., Lubiński, P., Gilfanov, M., & Revnivtsev, M. 2003, MNRAS, 342, 355 [NASA ADS] [CrossRef] [Google Scholar]
Appendix A: The 2011 XMM–Newton spectrum of NGC 4388
To analyse the 4–10 keV spectrum of the XMM3 obs. (see Table 3), we first assumed the best-fitting model described in Sect. 3, i.e. a cut-off power law plus a narrow Gaussian line modified by partial covering absorption. We fixed the cut-off energy at 200 keV, since we used only low-energy XMM–Newton data. We obtained a poor fit with χ2/d.o.f. = 153/85 and strong, negative residuals in the 6.5–7.0 keV band (see Fig. A.1). We thus added one narrow Gaussian line in absorption, finding an improved but still unacceptable fit (χ2/d.o.f. = 116/83). Then, we added a further absorption line, obtaining a good fit with χ2/d.o.f. = 71/81. The best-fitting parameters are reported in Table A.1. The photon index is  , that is to say flatter than the value of
  reported in Sect. 3. The absorbing column density is also lower, amounting to ∼2.4 × 1023 cm−2 instead of ∼3.8 × 1023 cm−2. The two absorption lines are found at rest-frame energies of
  keV and
  keV, and can be identified as the Kα lines of Fe XXV at 6.7 keV and of Fe XXVI at 6.966 keV, respectively. Ionised iron absorption lines have been detected in a number of objects. In many cases the line energies are blueshifted, implying an origin from a fast outflow (e.g. Tombesi et al. 2010). However, absorption from “static” or low-velocity ionised material has also been observed in some sources (Bianchi et al. 2005, and references therein). For example, Reeves et al. (2004) detected a variable absorption line from highly ionised iron in an XMM–Newton spectrum of the Seyfert 1 NGC 3783. This line was found to be stronger at higher continuum flux levels, and it was ascribed to a component of the warm absorber present in that source (Reeves et al. 2004). A proper test of this hypothesis is difficult in an obscured object like NGC 4388, and is out of the scope of the present work. However, following Reeves et al. (2004), we can tentatively ascribe the emergence of ionised iron absorption lines in the high-flux 2011 spectrum to a change in the ionisation level of the circumnuclear absorbing material due to an increase of the illuminating flux.
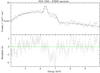 |
Fig. A.1. Upper panel: 2011 XMM–Newton spectrum of NGC 4388 fitted with a an absorbed power law plus a narrow Gaussian line. Lower panel: residuals as Δχ. |
Best-fitting parameters for the XMM3 obs. of NGC 4388.
All Tables
Previous constraints on high-energy cut-off and coronal temperature (both in keV) reported in literature.
IBIS source significance of NGC 4388 and NGC 2110 in three energy bands: 100–120 keV, 120–150 keV, 150–300 keV.
Best-fitting parameters for NGC 4388. (t) denotes a parameters tied between the spectra.
Best-fitting parameters for NGC 2110. (t) denotes a parameters tied between the spectra.
All Figures
|
Fig. 1. Residuals of fits of IBIS spectrum with different models. Upper panel: simple power law. Second panel: power law plus reflection (PEXRAV). Third panel: exponentially cut-off power law. Lower panel: thermal Comptonisation model (COMPPS). |
| In the text | |
|
Fig. 2. Upper panel: XMM–Newton and NuSTAR spectra of NGC 4388 with the cut-off power law that best fits IBIS. Lower panel: data/model ratio. Only NuSTAR’s FPMA data are shown for clarity. The data were binned for plotting purposes. |
| In the text | |
|
Fig. 3. Contour plots of cut-off energy vs. photon index for NGC 4388 (black) and NGC 2110 (red). Solid, dashed, and dotted lines correspond to 68, 90, and 99 per cent confidence level, respectively. |
| In the text | |
|
Fig. 4. Contour plots of Compton parameter y vs. electron temperature kTe for NGC 4388 (black) and NGC 2110 (red). Solid, dashed, and dotted lines correspond to 68, 90, and 99 per cent confidence level, respectively. Grey dotted lines correspond to constant values of optical depth. |
| In the text | |
|
Fig. 5. Upper panel: spectra of NGC 4388 with best-fitting COMPPS model. Second panel: residuals, plotted as Δχ = (data-model)/error. Third panel: best-fitting model E2f(E). The data were binned for plotting purposes. |
| In the text | |
|
Fig. 6. Residuals of fits of IBIS spectrum with different models. Upper panel: simple power law. Second panel: power law plus reflection (PEXRAV). Third panel: exponentially cut-off power law. Lower panel: thermal Comptonisation model (COMPPS). |
| In the text | |
|
Fig. 7. Upper panel: XMM–Newton and NuSTAR spectra of NGC 2110 with the cut-off power law that best fits IBIS. Lower panel: data/model ratio. Only NuSTAR’s FPMA data are shown for clarity. The data were binned for plotting purposes. |
| In the text | |
|
Fig. 8. Upper panel: spectra of NGC 2110 with best-fitting COMPPS model. Second panel: residuals, plotted as Δχ = (data-model)/error. Third panel: best-fitting model E2f(E). The data were binned for plotting purposes. |
| In the text | |
|
Fig. A.1. Upper panel: 2011 XMM–Newton spectrum of NGC 4388 fitted with a an absorbed power law plus a narrow Gaussian line. Lower panel: residuals as Δχ. |
| In the text | |
Current usage metrics show cumulative count of Article Views (full-text article views including HTML views, PDF and ePub downloads, according to the available data) and Abstracts Views on Vision4Press platform.
Data correspond to usage on the plateform after 2015. The current usage metrics is available 48-96 hours after online publication and is updated daily on week days.
Initial download of the metrics may take a while.