Free Access
Fig. 5.
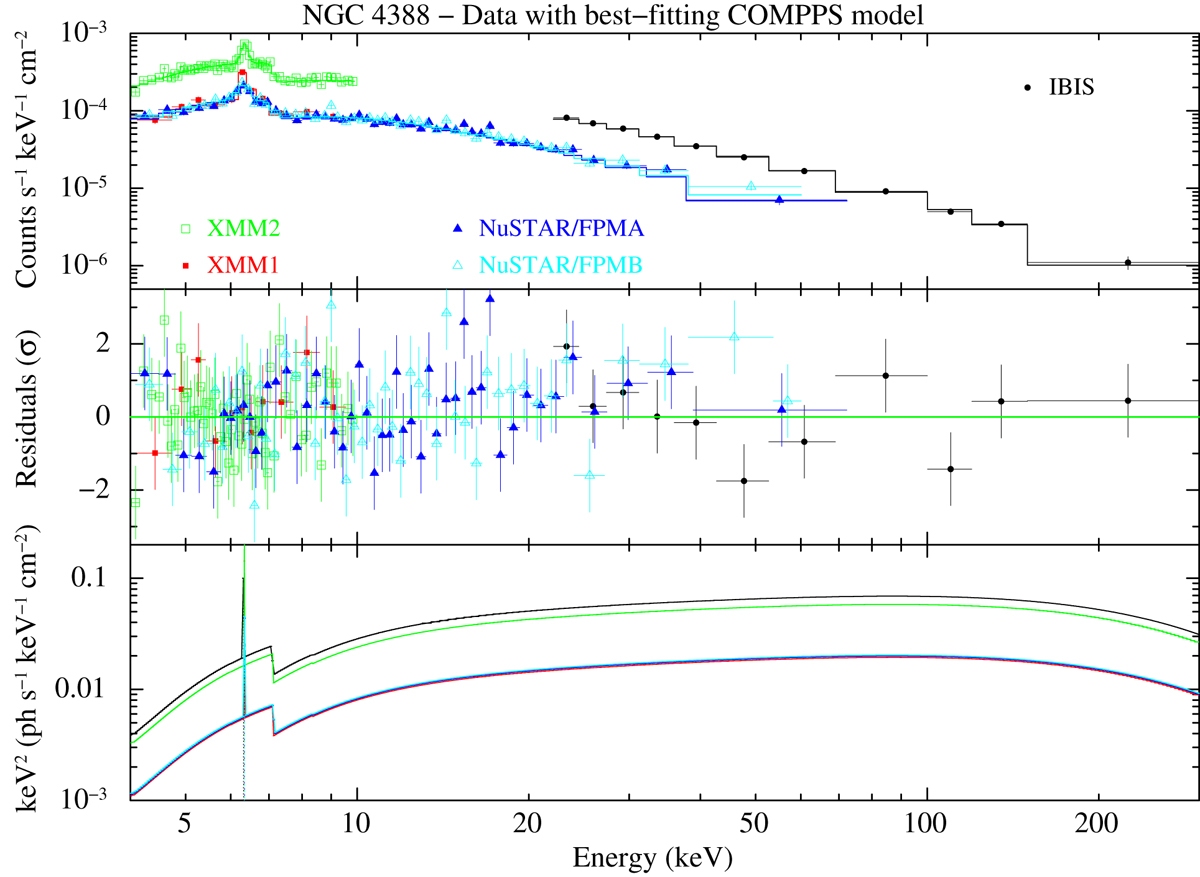
Upper panel: spectra of NGC 4388 with best-fitting COMPPS model. Second panel: residuals, plotted as Δχ = (data-model)/error. Third panel: best-fitting model E2f(E). The data were binned for plotting purposes.
Current usage metrics show cumulative count of Article Views (full-text article views including HTML views, PDF and ePub downloads, according to the available data) and Abstracts Views on Vision4Press platform.
Data correspond to usage on the plateform after 2015. The current usage metrics is available 48-96 hours after online publication and is updated daily on week days.
Initial download of the metrics may take a while.