| Issue |
A&A
Volume 629, September 2019
|
|
|---|---|---|
| Article Number | A5 | |
| Number of page(s) | 6 | |
| Section | Stellar structure and evolution | |
| DOI | https://doi.org/10.1051/0004-6361/201935351 | |
| Published online | 22 August 2019 | |
X-ray emission in the enigmatic CVSO 30 system
1
Hamburger Sternwarte, Universität Hamburg, Gojenbergsweg 112, 21029 Hamburg, Germany
e-mail: stefan.czesla@hs.uni-hamburg.de
2
Astronomical Institute ASCR, Fricova 298, 25165 Ondrejov, Czech Republic
Received:
24
February
2019
Accepted:
8
June
2019
CVSO 30 is a young, active, weak-line T Tauri star; it possibly hosts the only known planetary system with both a transiting hot-Jupiter and a cold-Jupiter candidate (CVSO 30 b and CVSO 30 c). We analyzed archival ROSAT, Chandra, and XMM-Newton data to study the coronal emission in the system. According to our modeling, CVSO 30 shows a quiescent X-ray luminosity of ≈8 × 1029 erg s−1. The X-ray absorbing column is consistent with interstellar absorption. XMM-Newton observed a flare, during which a transit of the candidate CVSO 30 b was expected, but no significant transit-induced variation in the X-ray flux is detectable. While the hot-Jupiter candidate CVSO 30 b has continuously been undergoing mass loss powered by the high-energy irradiation, we conclude that its evaporation lifetime is considerably longer than the estimated stellar age of 2.6 Myr.
Key words: stars: individual: CVSO 30 / planetary systems / X-rays: stars / stars: flare
© ESO 2019
1. Introduction
CVSO 30 is classified as a young weak-line T Tauri star (WTTS) in the Orion OB 1a association (Briceño et al. 2005, and Table 1). At an age of 2.6 Myr, CVSO 30 may host one of the youngest planetary systems known to date and the only one comprising both a hot- and a cold-Jupiter candidate (CVSO 30 b and CVSO 30 c, van Eyken et al. 2012; Schmidt et al. 2016). Both planetary candidates remain controversial to date (Yu et al. 2015; Onitsuka et al. 2017; Lee & Chiang 2018).
Parameters of CVSO 30 and hot-Jupiter candidate CVSO 30 b used in this study.
The presence of the transiting hot-Jupiter candidate CVSO 30 b was announced in 2012 when van Eyken et al. (2012) discovered recurring photometric fading events1 with a period of ≈0.44 d. These fading events are superimposed on a pronounced pattern of activity-induced rotational variability with a close (or identical) period (see also Koen 2015). van Eyken et al. (2012) suggested that the fading events may be attributable to transits by a hot Jupiter with a mass of Mp < 5.5 ± 1.4 MJ. However, the events show changes in shape, and occasionally even vanish entirely (van Eyken et al. 2012; Ciardi et al. 2015; Yu et al. 2015). To explain this behavior in the context of a planet, orbital precession was put forward by van Eyken et al. (2012) and detailed studies with theoretical solutions were presented by Barnes et al. (2013) and Kamiaka et al. (2015). Some of their results along with other relevant system parameters are given in Table 1. Further support for the planetary hypothesis comes from the analysis of variable, asymmetric Hα emission by Johns-Krull et al. (2016), who conclude that their observation is consistent with the existence of an evaporating planet CVSO 30 b.
Nevertheless, the planetary hypothesis does not remain uncontested. Having juxtaposed a number of alternatives to explain the fading events, Yu et al. (2015) concluded that an occulted hotspot model gains the most support from the considered data. The authors found the existence of a gas giant CVSO 30 b particularly difficult to reconcile with the lack of an observable occultation and phase shifts in the timing of the fading events. In addition, the detection of color-dependent fading events by Onitsuka et al. (2017) and Yu et al. (2015) is at odds with a planetary origin. Without digressing into more minute details, we confirm that the origin of the fading events remains disputed.
Any material in the vicinity of a young, active star like CVSO 30 is immersed in strong activity-induced extreme ultraviolet and X-ray emission (e.g., Stelzer & Neuhäuser 2001), frequently intensified by flaring (e.g., Favata et al. 2005). In a planetary atmosphere, such high-energy irradiation is absorbed in the upper layers, which expand and drive off mass in the form of a planetary wind (e.g., Salz et al. 2016a,b). The high-energy radiation thus plays a decisive role in shaping the environments of young stars, and the point of this paper is to deduce its characteristic properties in the CVSO 30 system.
2. Observations and data analysis
In the following, we analyze archival X-ray data from the XMM-Newton, Chandra, and ROSAT X-ray satellites, which all serendipitously observed CVSO 30.
2.1. XMM-Newton data
The XMM-Newton satellite is equipped with three X-ray telescopes (Jansen et al. 2001). At their focal plane, there are three CCD cameras provided by the European Photon Imaging Camera (EPIC) consortium. The assembly consists of two metal oxide semi-conductor (MOS) CCD arrays and one array of so-called pn-CCDs (Strüder et al. 2001; Turner et al. 2001). The fields of view of the pn and MOS cameras largely overlap, and they are usually operated simultaneously. All of them record the position, energy, and arrival time of individual X-ray photon events.
CVSO 30 was observed by XMM-Newton during a 63.9 ks observation nominally targeted at the 25 Orionis cluster carried out in March 2009 (Obs ID 0554610101). We reduced the data using XMM-Newton’s Science Analysis Software (SAS) version 13.5 using standard data reduction recipes2, where not stated otherwise.
In Fig. 1 we show the 0.5−2 keV band pn image of the surroundings of CVSO 30 along with our circular source and background extraction regions. The source region has a radius of 17 arcsec and covers about 80% of the photons on the pn chip (at 1.5 keV). There is a clear, point-like X-ray source at the position of CVSO 30 without distinguishable contamination from nearby sources within at least one arcminute.
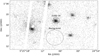 |
Fig. 1. XMM-Newton pn image images of CVSO 30 (0.5−2 keV band). The circles indicate our source and background extraction regions. |
During the observation the pn data show a slightly elevated but quite constant level of high-energy background (10−12 keV). The highest observed pn background count rate is 0.56 ct s−1, which is not too high above the recommended cutoff level of 0.4 ct s−1. Because CVSO 30 is neither an extended nor particularly weak X-ray source, we expect no serious background interference in the analysis and, consequently, applied no background filtering for the pn data. CVSO 30 was also observed with the MOS 2 camera, where high-energy background was no issue. The MOS 1 camera missed the target because it was positioned on CCD no. 6, which remained switched off during the observation.
2.1.1. X-ray photometry
In Fig. 2 we show the combined pn and MOS 2 X-ray light curve of CVSO 30, generated with the SAS task epiclccorr, which also applies a number of corrections3. The temporal binning is 400 s. The top panel shows the hard-band (1−9 keV) light curve and the bottom panel its soft-band (0.1−1 keV) counterpart. The X-ray light curve shows a strong flare during which the count rate rises by about an order of magnitude compared to the quiescent level; this flare was previously reported by Franciosini et al. (2011), but no detailed analysis was carried out.
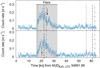 |
Fig. 2. Combined background-subtracted MOS 2 and pn light curves of CVSO 30 with a binning of 400 s. Bottom panel: soft-band light curve (0.1−1 keV). Top panel: hard-band (1−9 keV) counterpart. The adopted flare period is indicated by gray shading. Vertical lines indicate the times of fading events according to different ephemerides: the linear and quadratic ephemerides given by Yu et al. (2015) indicated by dash-dotted and dotted lines, and the ephemerides by Raetz et al. (2016) indicated by dashed lines. Two arrows indicate the potential dips discussed in Sect. 3.3. |
In Fig. 2 we also show our definition of the flaring period, which starts at MJD 54 891.847 and lasts for 17 ks. Given that the stellar rotation period is almost identical to or slightly larger than the planetary orbital period of 39.7 ks (van Eyken et al. 2012; Raetz et al. 2016), the flare lasts for essentially half a stellar rotation period. Even so, the flare light curve shows no evidence of an occultation of the flare region by the star. As the flaring material is thought to be optically thin, no strong line-of-sight effects related to the change in viewing geometry caused by rotation are expected.
In addition, Fig. 2 shows the times of the fading events according to both the linear and quadratic ephemerides given by Yu et al. (2015) and the ephemerides found by Raetz et al. (2016). In the nomenclature used by Yu et al. (2015), the covered epochs are −690 and −6894. The ephemerides given by van Eyken et al. (2012) show fading event times preceding those predicted by Raetz et al. (2016) by about 2 ks. The formal (statistical) uncertainty of the fading event times is 0.6 ks in the case of Yu et al. (2015) and 0.1 ks in the case of Raetz et al. (2016). As the earliest photometric data published by van Eyken et al. (2012) were obtained in Dec 2009 (i.e., about six months after the XMM-Newton observations), all calculations of the fading event times require extrapolation. Therefore, we argue that the difference between these different predicted times gives an impression of the true uncertainty involved. Nonetheless, all considered ephemerides predict that a fading event may have occurred sometime during the flare.
As may be expected in such an active star, the out-of-flare X-ray count rate is not strictly constant. While the mean combined pn and MOS 2 pre-flare count rate is 27 ± 2 ct ks−1, its post-flare equivalent is 40 ± 2 ct ks−1, which may be attributable to intrinsic coronal variability or rotational modulation. Nevertheless, we treat the pre- and post-flare periods as a single quiescent period in our analysis.
2.1.2. Spectral analysis
We carried out a spectral analysis for the quiescent and flare periods as defined above using XSPEC version 12.9.1 (Arnaud 1996). Before the spectral fit, we grouped the observed spectra so that each spectral energy bin contains 15 counts. To model the spectrum during the quiescent period, we used a two-temperature model computed with the Astrophysical Plasma Emission Code (APEC) for optically thin plasmas in collisional ionization equilibrium (Smith et al. 2001)5. The elemental abundances were all combined into a single scaling parameter. In modeling the average flare spectrum, we assumed that the contribution from the quiescent phase remained constant and added a third thermal component with independent abundances to describe the flare-induced spectral change. The resulting parameters are given in Table 2 and the EPIC-pn quiescence and flare spectra along with the best-fit models are shown in Fig. 3.
Results of spectral modeling of the XMM-Newton and Chandra data along with 68% confidence intervals.
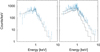 |
Fig. 3. XMM-Newton EPIC-pn spectrum and best-fit model (solid line) during quiescence (left) and flare (right) periods. For reference, we also show the quiescent spectrum in the flare panel (dotted line). |
According to our modeling the coronal abundances of CVSO 30 are subsolar with respect to the solar (photospheric) abundances given by Anders & Grevesse (1989). During the flare the spectrum hardens as expected. The average flare X-ray luminosity, LX, flare, listed in Table 2 includes the quiescent contribution. Subtracting the quiescent level, we estimate that the flare released a total of

in the 0.3−9 keV band. While this is certainly a strong flare compared to flares observed on CN Leo, for example (Schmitt et al. 2008), it still releases two to three orders of magnitude less energy in X-rays than the strongest flares observed on young stars of comparable age in Orion (Favata et al. 2005).
2.2. Chandra data
Chandra observed CVSO 30 twice on January 8 and 13, 2008 (Obs. IDs 8573 and 8572). The observations lasted for about 10 ks each and were carried out with the same setup. The observations were used in the study by Ingleby et al. (2011), but no analysis of the specific source CVSO 30 is presented there. In both observations, CVSO 30 is found far from the aim point on the ACIS-I detector where Chandra’s point spread function (PSF) is much broader than for on-axis sources. Having inspected nearby stronger X-ray sources, we opted for a circular extraction region with a radius of 25 arcsec placed on the nominal source position to carry out the analysis.
In both of the Chandra images an X-ray source at the location of CVSO 30 is clearly visible. In particular, we find 44.9 and 18.4 excess photons in the source regions in the observations 8573 and 8572. We used CIAO version 4.7 with CALDB version 4.6.5 to obtain spectra and light curves using standard analysis threads6.
Both Chandra light curves of CVSO 30 are compatible with a constant source count rate without major flares or strong gradients. Therefore, we proceeded to obtain spectra, which we grouped to five counts per spectral bin. The spectra were modeled using an absorbed single-component thermal plasma model using XSPEC. Because of the low number of counts, we specifically assumed Poisson-distributed source and background rates in our analysis (cstat option in XSPEC). As the interstellar hydrogen absorption column and the coronal elemental abundances are not constrained by the Chandra data, we fixed them to the values derived from the XMM-Newton observation. Our fit results are also listed in Table 2.
The temperature, emission measure, and also X-ray luminosity derived from the Chandra observation on January 8 are compatible with the values found during the quiescent phase observed by XMM-Newton. For the observation on January 13 our modeling yields a source fainter by about a factor of two and also somewhat cooler than on January 8. Both Chandra observations are relatively short and, factoring in the usual degree of variability in the X-ray flux of young stars, we consider the results consistent with the quiescent phase observed by XMM-Newton.
2.3. ROSAT data
ROSAT observed the CVSO 30 system for 23 ks with the High Resolution Imager (HRI) in March 1994 (Rosat Observation Request 201392h). Although CVSO 30 was located rather far from the aim point, we detected a clear source with a best-fit position 8 arcsec from the nominal position of CVSO 30, which is quite typical for sources observed in ROSAT HRI pointings (e.g., Sasaki et al. 2000). In particular, we found an excess of 30 ± 8.5 cts corresponding to an HRI count rate of 1.4 ± 0.4 ct ks−1.
Using WebPIMMS 7, we derived a count–energy conversion factor of 3.67 × 10⁻¹¹ erg cm−2 s−1 ct−1 (0.3−9.0 keV band) assuming a 1.2 keV thermal model with 20% solar abundances (cf. Sect. 2.1) and an absorption column of 2.9 × 1020 cm−2. This yields an estimate of (6.7 ± 1.9) × 1029 erg s−1 for the unabsorbed X-ray luminosity of the target, which is consistent with the quiescent luminosities obtained from the analysis of the XMM-Newton and Chandra data.
3. Discussion
3.1. Quiescent X-ray spectrum
From our analysis of the ROSAT, XMM-Newton, and Chandra data, we deduced consistent X-ray luminosities of about 8 × 1029 erg s−1 for CVSO 30. This level of quiescent X-ray emission is compatible with the distribution of X-ray luminosities of WTTSs with similar mass in Orion and M16, whose age is about 1 Myr (Getman et al. 2005; Guarcello et al. 2012). Formally, the relation between mass and X-ray luminosity given by Guarcello et al. (2012, their Eq. (2)) yields an estimate of 2.9 × 1030 erg s−1 for a WTTS (i.e., a class III object) with a mass of 0.4 M⊙, where the scatter of the distribution amounts to about two orders of magnitude. The value is also compatible with the mean X-ray luminosity of (10 ± 2.5) × 1029 erg s−1 of fast-rotating (v sin(i) > 22 km s−1) WTTSs in the Taurus-Auriga-Perseus region (Stelzer & Neuhäuser 2001).
Our finding of subsolar coronal abundances in CVSO 30 with respect to the solar photosphere (Table 2) is not uncommon for highly active stars (e.g., Scelsi et al. 2007). We are not aware of an estimate of the photospheric abundances in CVSO 30 that can be used for comparison. The relation between coronal and photospheric abundances can be rather complex in the Sun and other stars (e.g., Feldman 1992; Laming et al. 1996; Drake et al. 1997; Güdel & Nazé 2009).
Our analysis indicates that the quiescent level of X-ray emission of CVSO 30 remained stable to within a factor of about two for at least 15 yr, i.e., the time between the ROSAT and XMM-Newton observations. This finding is in line with the results reported by Telleschi et al. (2007), who find a similar variation between ROSAT and XMM-Newton observations in their study of nine T Tauri stars. Other highly active stars such as the 50 Myr old AB Dor and the RS CVn binaries AR Lac and HR 1099 also show similarly constant levels of X-ray emission, disregarding strong short-term variability due to flares (Lalitha & Schmitt 2013; Drake et al. 2014; Perdelwitz et al. 2018).
With a bolometric luminosity of 0.25 L⊙ (van Eyken et al. 2012), a quiescent X-ray luminosity of 8 × 1029 erg s−1 yields a log10(LX/Lbol) ratio of −3.1. This puts CVSO 30 close to the saturation limit of −3 (Pizzolato et al. 2003), which is consistent with it being a young pre-main-sequence star. Adopting the radius of 1.03 R⊙ given by Barnes et al. (2013), we derive a value of log10(FX [erg cm−2 s−1]) = 7.1 for the X-ray surface flux. This value is not unusual for fast-rotating T Tauri stars (Stelzer & Neuhäuser 2001) or the most active K- and M-type stars in the solar neighborhood (Schmitt 1997, Fig. 8).
3.2. Absorption column density
While extinction at photon energies in excess of 0.53 keV, i.e., the K-shell edge of oxygen, is dominated by heavy elements irrespective of their chemical state, optical extinction is mainly caused by dust grains (e.g., Predehl & Schmitt 1995; Güver & Özel 2009; Wilms et al. 2000; McJunkin et al. 2014). The depth of the hydrogen column and the amount of optical extinction are closely correlated in the interstellar medium so that NH [cm−2] ∼ AV [mag]. However, published constants of proportionality differ by up to about 25% (see Güver & Özel 2009).
Adopting the value of 1.79 × 1021 cm−2 reported by Predehl & Schmitt (1995), we converted the hydrogen column density of ≈2.9 × 1020 cm−2 deduced from the XMM-Newton data into an optical extinction coefficient, AV, of 0.16 ± 0.06 mag. This value is compatible with the number of 0.12 mag given by Briceño et al. (2005) for CVSO 30. The properties of the absorbing material are therefore consistent with those of the interstellar medium; in particular, no significant excess of gas or dust extinction is measured. Assuming an average density of one particle per cm3 along the line of sight (Welsh et al. 2010) yields an estimate of 1021 cm−2 for the interstellar column density toward CVSO 30. Therefore, is seems plausible that the observed absorption is largely interstellar in origin.
3.3. Any X-ray fading events?
While the predictions for the timing of the fading events differ depending on the assumed ephemerides (see Sect. 2.1.1), it appears plausible that the flare covers one such event. Given the temporary disappearance of the optical fading events, we cannot be sure that any took place at all in this epoch however. Nonetheless, we scrutinized the light curves for any X-ray variability potentially associated with optical fading.
It is clear that the transit of a planetary disk causing a small optical depression would be impossible to detect in X-rays with the data at hand unless a compact flaring region was eclipsed. For example, Briggs & Pye (2003) report a 60% drop in the X-ray count rate lasting for a total of about 1.4 ks during an X-ray flare on the K3V-type Pleiades member star H II 1100, which they argue might plausibly be caused by a hot Jupiter eclipsing the flaring region. However, they caution that the passage of cool and dense prominence material across the flaring region (see also Haisch et al. 1983) or a peculiar superposition of flare events also provide viable explanations. In any case, the transit of a more extended cloud of material, whether associated with a planet or not, might be more easily detectable.
About 20 ks into the XMM-Newton observation (Fig. 2), the soft-band count rate drops by ≈35% for ≈800 s, i.e., two data points. This timescale is consistent with the occultation of a point-like source by the hypothesized planetary body of CVSO 30 b. However, the lack of an associated depression in the hard-band light curve makes an eclipse by a solid planetary disk unlikely. A temporary elevation in the absorption column by 1021 cm−2 (e.g., caused by the transit of an extended planetary atmosphere) produces a count rate drop of 60% in the soft band with only a 10% drop in the hard band. Such a scenario would thus be compatible with the observation. By means of a Student’s t-test, we find that the mean of the two data points in question differs from that of the sample consisting of the two preceding and following points at the 2% significance level. As the ephemerides are uncertain, however, we count about ten similar opportunities during the flare where such an occultation may have happened and be interpreted in the same way. Therefore, the chance to obtain such a result by chance is about 20%, and we conclude that the data remain insufficient to produce a significant result.
The hard-band light curve shows an apparent depression about 25 ks into the XMM-Newton observation (Fig. 2). This variation has no counterpart in the soft-band light curve, however, and might be more easily explained by the superposition of two flares or secondary heating rather than absorption or occultation of flaring material.
3.4. Planetary irradiation and mass loss
Having measured the stellar X-ray flux, we now estimate the expected mass-loss rate of the candidate hot Jupiter CVSO 30 b to see whether such a configuration is physically plausible. A number of values have been proposed for the mass of CVSO 30 b (e.g., Barnes et al. 2013; Ciardi et al. 2015, or Johns-Krull et al. 2016). These range from approximately one to seven Jovian masses. We assume here a stellar mass of 0.44 M⊙, a planetary mass of 3.9 MJ, and a planetary radius of 1.61 RJ. These values are based on those given in Table 1. To remain on the conservative side regarding the planetary mass-loss rate, we increased the nominal mass estimate in Table 1 by its uncertainty and decreased the radius likewise. Both choices increase the assumed planetary density and inhibit mass loss. Kepler’s third law then demands a semimajor axis, a, of 0.00874 AU. The resulting Roche-lobe geometry is shown in Fig. 4. The shape of the planetary candidate CVSO 30 b is determined by an equipotential surface, the level of which is given by the radius derived from transit modeling. The result clearly demonstrates the expected deviation from spherical geometry.
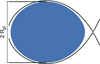 |
Fig. 4. Roche lobe (solid line) and extent (blue shade) of planetary candidate CVSO 30 b in the orbital plane (0.44 M⊙, 3.9 MJ, and 1.61 RJ). |
Energy-limited escape is based on the assumption that the complete energy input obtained through high-energy irradiation is used to lift planetary material from the surface to the Roche lobe height (Watson et al. 1981). Substituting a quiescent X-ray luminosity of 8 × 1029 erg s−1 yields an irradiation of 3.7 × 10⁶ erg cm−2 s−1 at the distance of the planet. Curiously, the level of surface irradiation varies by about 10% because the substellar point on the planetary surface is noticeably closer to the star than the terminator is as the orbital semimajor axis corresponds to a mere 18 Jupiter radii.
Using the relation between the X-ray (5−124 Å) and extreme ultraviolet (EUV, 124−912 Å) stellar surface flux presented by Chadney et al. (2015, Eq. (2b)), we estimate a value of 1.2 × 1030 erg s−1 for the combined stellar EUV and X-ray (XUV) luminosity of CVSO 30. The resulting XUV flux at the planetary orbital distance then becomes FXUV = 5.4 × 10⁶ erg cm−2 s−1. The energy-limited planetary mass-loss rate is given by
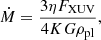
where η is the heating efficiency, G is the gravitational constant, ρpl is the mean density of the planet, and K is the fractional gravitational potential difference between the Roche lobe height and the planetary surface (Erkaev et al. 2007). In the case of CVSO 30 b, we computed an exact value of 2.068 × 10⁻³ for K, and we chose η = 0.15 following Salz et al. (2015). With these parameters, we obtained an energy-limited mass-loss rate of Ṁ = 3.8 × 10¹⁵ g s−1 or 0.063 MJ Myr−1, which means that the planetary candidate CVSO 30 b would evaporate within 62 Myr.
Our estimate of the planetary mass-loss rate may be compared to the values derived by Johns-Krull et al. (2016), based on their analysis of the Hα line profile. Johns-Krull et al. (2016) consider a scenario of planet-fed accretion and roughly estimated that a mass accretion rate of 3 × 10⁻¹⁰ M⊙ yr−1 or 2 × 10¹⁶ g s−1 is required to explain the observations. While this rate is about an order of magnitude above our estimate, both numbers are subject to significant uncertainty. Moreover, planetary mass loss may be intermittently enhanced by flaring, and accretion may be episodic as well, as already suggested by Johns-Krull et al. (2016).
Flaring is expected to temporarily increase the planetary mass-loss rate. In their simulations, Bisikalo et al. (2018) find that the mass-loss rate approximately doubles for a ten-fold increase in the XUV irradiation level. During the CVSO 30 flare observed by XMM-Newton, the average X-ray luminosity increased by about a factor of five so that we may expect an elevation of about a factor of two in the mass-loss rate. The mass-loss rate of CVSO 30 b and its temporal variability certainly remain subject to considerable uncertainty due to the uncertain properties of the planet and the mass-loss process. We therefore conclude that our estimate is not necessarily in contradiction with that derived by Johns-Krull et al. (2016). Mass loss is expected to affect the evolution of a planet like CVSO 30 b, which may eventually be stripped down to a rocky core, as has been suggested in the case of CoRoT-7 b (Jackson et al. 2010). Nevertheless, the estimated lifetime of 62 Myr is about 20 times longer than the system age, so that we are confident that evaporation does not render a planet at the position of CVSO 30 b implausible.
4. Summary and conclusion
We analyzed one ROSAT, one XMM-Newton, and two shorter Chandra X-ray pointings, which serendipitously covered CVSO 30. According to our analysis, the quiescent X-ray luminosity of CVSO 30 is about ≈8 × 1029 erg s−1 and the X-ray spectrum is consistent with only interstellar absorption. The X-ray properties of CVSO 30 are typical of a WTTS of similar spectral type and age.
During the XMM-Newton observation, CVSO 30 showed an X-ray flare that released about 6.8 × 1034 erg in the 0.3−9 keV band. Based on the ephemerides published by van Eyken et al. (2012), Yu et al. (2015), and Raetz et al. (2016) it appears plausible that an optical fading event took place during the flare; however, no simultaneous optical photometry is available to verify this supposition. The X-ray light curve shows no conclusive evidence for an X-ray counterpart of an optical fading event.
On the assumption that a hot Jupiter CVSO 30 b exists, we estimate a mass-loss rate of 3.8 × 10¹⁵ g s−1 based on energy-limited escape, which yields an approximate lifetime of 62 Myr, broadly consistent with the value of 20 Myr estimated by Johns-Krull et al. (2016). While the true status of the candidate planet CVSO 30 b cannot be decided based on our study, the current system age of 2.6 Myr is consistent with such a configuration.
van Eyken et al. (2012) actually dubbed them transits; here we adopt the nomenclature also used by Yu et al. (2015).
These corresponds to epochs −1453 and −1452 according to the ephemerides given by van Eyken et al. (2012) and Raetz et al. (2016).
See also http://atomdb.org/
Acknowledgments
Based on observations obtained with XMM-Newton, an ESA science mission with instruments and contributions directly funded by ESA Member States and NASA. The scientific results reported in this article are based in part on data obtained from the Chandra Data Archive. We have made use of the ROSAT Data Archive of the Max-Planck-Institut für extraterrestrische Physik (MPE) at Garching, Germany. SC acknowledges support through DFG projects SCH 1382/2-1 and SCHM 1032/66-1.
References
- Anders, E., & Grevesse, N. 1989, Geochim. Cosmochim. Acta, 53, 197 [Google Scholar]
- Arnaud, K. A. 1996, in Astronomical Data Analysis Software and Systems V, eds. G. H. Jacoby, & J. Barnes, ASP Conf. Ser., 101, 17 [NASA ADS] [Google Scholar]
- Barnes, J. W., van Eyken, J. C., Jackson, B. K., Ciardi, D. R., & Fortney, J. J. 2013, ApJ, 774, 53 [NASA ADS] [CrossRef] [Google Scholar]
- Bisikalo, D. V., Shematovich, V. I., Cherenkov, A. A., Fossati, L., & Möstl, C. 2018, ApJ, 869, 108 [NASA ADS] [CrossRef] [Google Scholar]
- Briceño, C., Calvet, N., Hernández, J., et al. 2005, AJ, 129, 907 [NASA ADS] [CrossRef] [Google Scholar]
- Briggs, K. R., & Pye, J. P. 2003, MNRAS, 345, 714 [NASA ADS] [CrossRef] [Google Scholar]
- Chadney, J. M., Galand, M., Unruh, Y. C., Koskinen, T. T., & Sanz-Forcada, J. 2015, Icarus, 250, 357 [NASA ADS] [CrossRef] [Google Scholar]
- Ciardi, D. R., van Eyken, J. C., Barnes, J. W., et al. 2015, ApJ, 809, 42 [NASA ADS] [CrossRef] [Google Scholar]
- Drake, J. J., Laming, J. M., & Widing, K. G. 1997, ApJ, 478, 403 [NASA ADS] [CrossRef] [Google Scholar]
- Drake, J. J., Ratzlaff, P., Kashyap, V., et al. 2014, ApJ, 783, 2 [NASA ADS] [CrossRef] [Google Scholar]
- Erkaev, N. V., Kulikov, Y. N., Lammer, H., et al. 2007, A&A, 472, 329 [NASA ADS] [CrossRef] [EDP Sciences] [Google Scholar]
- Favata, F., Flaccomio, E., Reale, F., et al. 2005, ApJS, 160, 469 [NASA ADS] [CrossRef] [Google Scholar]
- Feldman, U. 1992, Phys. Scr., 46, 202 [CrossRef] [Google Scholar]
- Franciosini, E., Sacco, G. G., & Randich, S. 2011, in The X-ray Universe 2011, eds. J. U. Ness, & M. Ehle, 207 [Google Scholar]
- Gaia Collaboration (Prusti, T., et al.) 2016, A&A, 595, A1 [NASA ADS] [CrossRef] [EDP Sciences] [Google Scholar]
- Gaia Collaboration (Brown, A. G. A., et al.) 2018, A&A, 616, A1 [NASA ADS] [CrossRef] [EDP Sciences] [Google Scholar]
- Getman, K. V., Flaccomio, E., Broos, P. S., et al. 2005, ApJS, 160, 319 [NASA ADS] [CrossRef] [Google Scholar]
- Guarcello, M. G., Caramazza, M., Micela, G., et al. 2012, ApJ, 753, 117 [NASA ADS] [CrossRef] [Google Scholar]
- Güdel, M., & Nazé, Y. 2009, A&ARv, 17, 309 [NASA ADS] [CrossRef] [Google Scholar]
- Güver, T., & Özel, F. 2009, MNRAS, 400, 2050 [NASA ADS] [CrossRef] [Google Scholar]
- Haisch, B. M., Linsky, J. L., Bornmann, P. L., et al. 1983, ApJ, 267, 280 [NASA ADS] [CrossRef] [Google Scholar]
- Ingleby, L., Calvet, N., Hernández, J., et al. 2011, AJ, 141, 127 [NASA ADS] [CrossRef] [Google Scholar]
- Jackson, B., Miller, N., Barnes, R., et al. 2010, MNRAS, 407, 910 [NASA ADS] [CrossRef] [Google Scholar]
- Jansen, F., Lumb, D., Altieri, B., et al. 2001, A&A, 365, L1 [NASA ADS] [CrossRef] [EDP Sciences] [Google Scholar]
- Johns-Krull, C. M., Prato, L., McLane, J. N., et al. 2016, ApJ, 830, 15 [NASA ADS] [CrossRef] [Google Scholar]
- Kamiaka, S., Masuda, K., Xue, Y., et al. 2015, PASJ, 67, 94 [NASA ADS] [CrossRef] [Google Scholar]
- Koen, C. 2015, MNRAS, 450, 3991 [NASA ADS] [CrossRef] [Google Scholar]
- Lalitha, S., & Schmitt, J. H. M. M. 2013, A&A, 559, A119 [NASA ADS] [CrossRef] [EDP Sciences] [Google Scholar]
- Laming, J. M., Drake, J. J., & Widing, K. G. 1996, ApJ, 462, 948 [NASA ADS] [CrossRef] [Google Scholar]
- Lee, C.-H., & Chiang, P.-S. 2018, ApJ, 852, L24 [NASA ADS] [CrossRef] [Google Scholar]
- McJunkin, M., France, K., Schneider, P. C., et al. 2014, ApJ, 780, 150 [NASA ADS] [CrossRef] [Google Scholar]
- Onitsuka, M., Fukui, A., Narita, N., et al. 2017, PASJ, 69, L2 [NASA ADS] [CrossRef] [Google Scholar]
- Perdelwitz, V., Navarrete, F. H., Zamponi, J., et al. 2018, A&A, 616, A161 [NASA ADS] [CrossRef] [EDP Sciences] [Google Scholar]
- Pizzolato, N., Maggio, A., Micela, G., Sciortino, S., & Ventura, P. 2003, A&A, 397, 147 [NASA ADS] [CrossRef] [EDP Sciences] [Google Scholar]
- Predehl, P., & Schmitt, J. H. M. M. 1995, A&A, 293, 889 [NASA ADS] [Google Scholar]
- Raetz, S., Schmidt, T. O. B., Czesla, S., et al. 2016, MNRAS, 460, 2834 [NASA ADS] [CrossRef] [Google Scholar]
- Salz, M., Schneider, P. C., Czesla, S., & Schmitt, J. H. M. M. 2015, A&A, 576, A42 [NASA ADS] [CrossRef] [EDP Sciences] [Google Scholar]
- Salz, M., Schneider, P. C., Czesla, S., & Schmitt, J. H. M. M. 2016a, A&A, 585, L2 [NASA ADS] [CrossRef] [EDP Sciences] [Google Scholar]
- Salz, M., Czesla, S., Schneider, P. C., & Schmitt, J. H. M. M. 2016b, A&A, 586, A75 [NASA ADS] [CrossRef] [EDP Sciences] [Google Scholar]
- Sasaki, M., Haberl, F., & Pietsch, W. 2000, A&AS, 147, 75 [NASA ADS] [CrossRef] [EDP Sciences] [Google Scholar]
- Scelsi, L., Maggio, A., Micela, G., Briggs, K., & Güdel, M. 2007, A&A, 473, 589 [NASA ADS] [CrossRef] [EDP Sciences] [Google Scholar]
- Schmidt, T. O. B., Neuhäuser, R., Briceño, C., et al. 2016, A&A, 593, A75 [NASA ADS] [CrossRef] [EDP Sciences] [Google Scholar]
- Schmitt, J. H. M. M. 1997, A&A, 318, 215 [NASA ADS] [Google Scholar]
- Schmitt, J. H. M. M., Reale, F., Liefke, C., et al. 2008, A&A, 481, 799 [NASA ADS] [CrossRef] [EDP Sciences] [Google Scholar]
- Smith, R. K., Brickhouse, N. S., Liedahl, D. A., & Raymond, J. C. 2001, ApJ, 556, L91 [NASA ADS] [CrossRef] [Google Scholar]
- Stelzer, B., & Neuhäuser, R. 2001, A&A, 377, 538 [NASA ADS] [CrossRef] [EDP Sciences] [Google Scholar]
- Strüder, L., Briel, U., Dennerl, K., et al. 2001, A&A, 365, L18 [NASA ADS] [CrossRef] [EDP Sciences] [Google Scholar]
- Telleschi, A., Güdel, M., Briggs, K. R., Audard, M., & Scelsi, L. 2007, A&A, 468, 443 [NASA ADS] [CrossRef] [EDP Sciences] [Google Scholar]
- Turner, M. J. L., Abbey, A., Arnaud, M., et al. 2001, A&A, 365, L27 [NASA ADS] [CrossRef] [EDP Sciences] [Google Scholar]
- van Eyken, J. C., Ciardi, D. R., von Braun, K., et al. 2012, ApJ, 755, 42 [NASA ADS] [CrossRef] [Google Scholar]
- Watson, A. J., Donahue, T. M., & Walker, J. C. G. 1981, Icarus, 48, 150 [NASA ADS] [CrossRef] [Google Scholar]
- Welsh, B. Y., Lallement, R., Vergely, J.-L., & Raimond, S. 2010, A&A, 510, A54 [NASA ADS] [CrossRef] [EDP Sciences] [Google Scholar]
- Wilms, J., Allen, A., & McCray, R. 2000, ApJ, 542, 914 [NASA ADS] [CrossRef] [Google Scholar]
- Yu, L., Winn, J. N., Gillon, M., et al. 2015, ApJ, 812, 48 [NASA ADS] [CrossRef] [Google Scholar]
All Tables
Results of spectral modeling of the XMM-Newton and Chandra data along with 68% confidence intervals.
All Figures
|
Fig. 1. XMM-Newton pn image images of CVSO 30 (0.5−2 keV band). The circles indicate our source and background extraction regions. |
| In the text | |
|
Fig. 2. Combined background-subtracted MOS 2 and pn light curves of CVSO 30 with a binning of 400 s. Bottom panel: soft-band light curve (0.1−1 keV). Top panel: hard-band (1−9 keV) counterpart. The adopted flare period is indicated by gray shading. Vertical lines indicate the times of fading events according to different ephemerides: the linear and quadratic ephemerides given by Yu et al. (2015) indicated by dash-dotted and dotted lines, and the ephemerides by Raetz et al. (2016) indicated by dashed lines. Two arrows indicate the potential dips discussed in Sect. 3.3. |
| In the text | |
|
Fig. 3. XMM-Newton EPIC-pn spectrum and best-fit model (solid line) during quiescence (left) and flare (right) periods. For reference, we also show the quiescent spectrum in the flare panel (dotted line). |
| In the text | |
|
Fig. 4. Roche lobe (solid line) and extent (blue shade) of planetary candidate CVSO 30 b in the orbital plane (0.44 M⊙, 3.9 MJ, and 1.61 RJ). |
| In the text | |
Current usage metrics show cumulative count of Article Views (full-text article views including HTML views, PDF and ePub downloads, according to the available data) and Abstracts Views on Vision4Press platform.
Data correspond to usage on the plateform after 2015. The current usage metrics is available 48-96 hours after online publication and is updated daily on week days.
Initial download of the metrics may take a while.