Fig. 2.
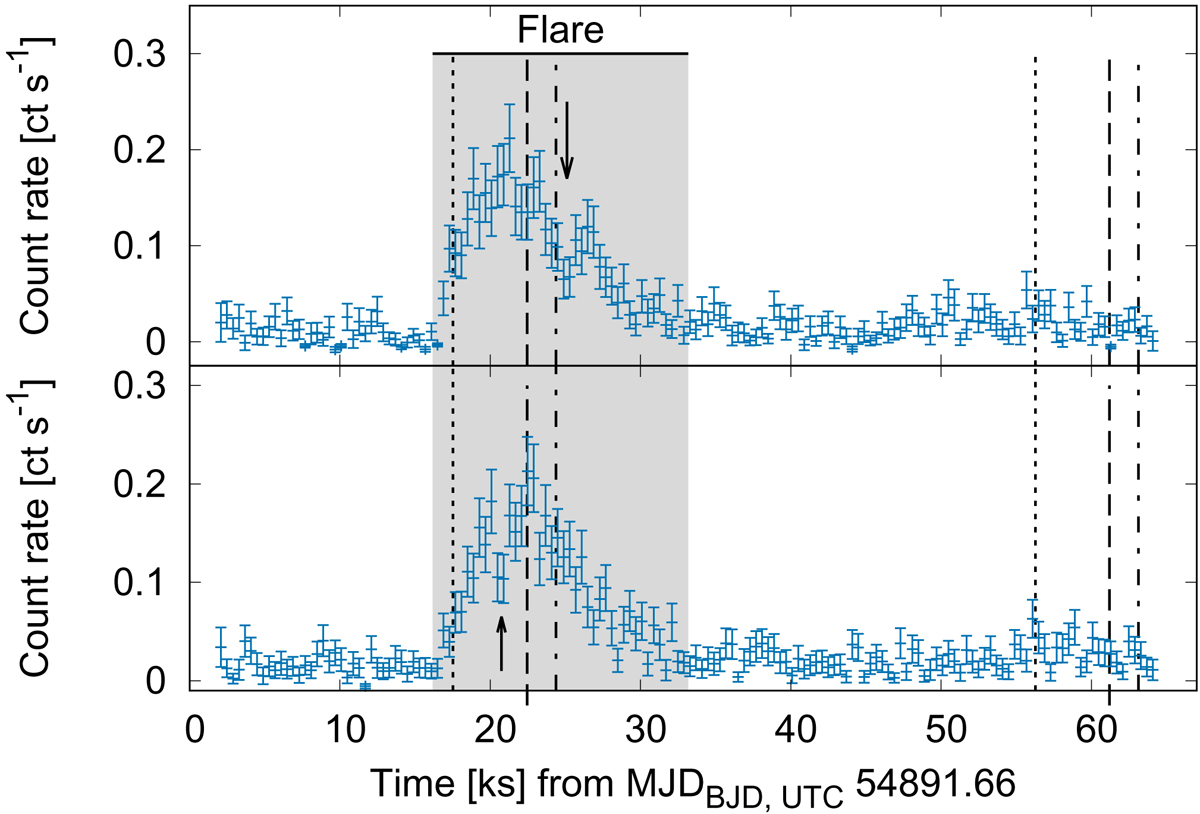
Combined background-subtracted MOS 2 and pn light curves of CVSO 30 with a binning of 400 s. Bottom panel: soft-band light curve (0.1−1 keV). Top panel: hard-band (1−9 keV) counterpart. The adopted flare period is indicated by gray shading. Vertical lines indicate the times of fading events according to different ephemerides: the linear and quadratic ephemerides given by Yu et al. (2015) indicated by dash-dotted and dotted lines, and the ephemerides by Raetz et al. (2016) indicated by dashed lines. Two arrows indicate the potential dips discussed in Sect. 3.3.
Current usage metrics show cumulative count of Article Views (full-text article views including HTML views, PDF and ePub downloads, according to the available data) and Abstracts Views on Vision4Press platform.
Data correspond to usage on the plateform after 2015. The current usage metrics is available 48-96 hours after online publication and is updated daily on week days.
Initial download of the metrics may take a while.