Fig. A.1.
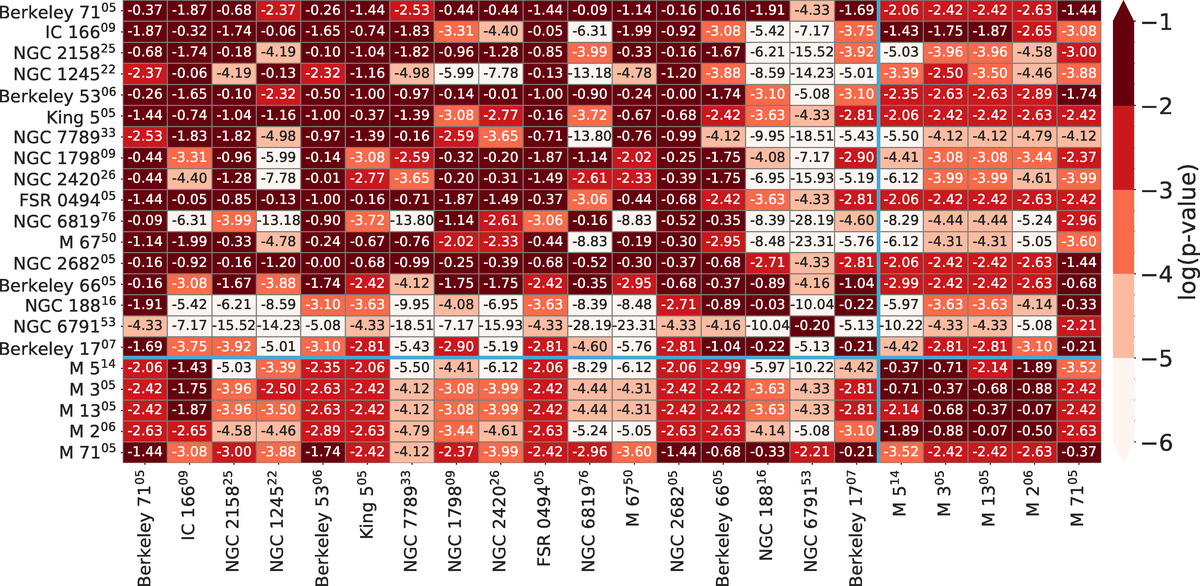
Same as Fig. 2 for the calibrated abundances. Logarithm of the p-values of the K–S two-sample test for the carbon distributions of each pair of clusters. The cells are colored in five shades of red, from light to dark in logarithmic scale. Inside each cell, we show the p-value of the test for that particular pair of clusters. Superscripts in cluster names indicate the number of stars in the cluster. The main diagonal shows the median p-value of 1000 tests resulting from randomly dividing the cluster into two subsamples of nearly equal sizes. Two blue lines separate the objects into globular clusters (lower right) and open clusters (upper left). Dark red represents values greater than 0.01: we cannot reject the null hypothesis for these cases.
Current usage metrics show cumulative count of Article Views (full-text article views including HTML views, PDF and ePub downloads, according to the available data) and Abstracts Views on Vision4Press platform.
Data correspond to usage on the plateform after 2015. The current usage metrics is available 48-96 hours after online publication and is updated daily on week days.
Initial download of the metrics may take a while.