Fig. 6.
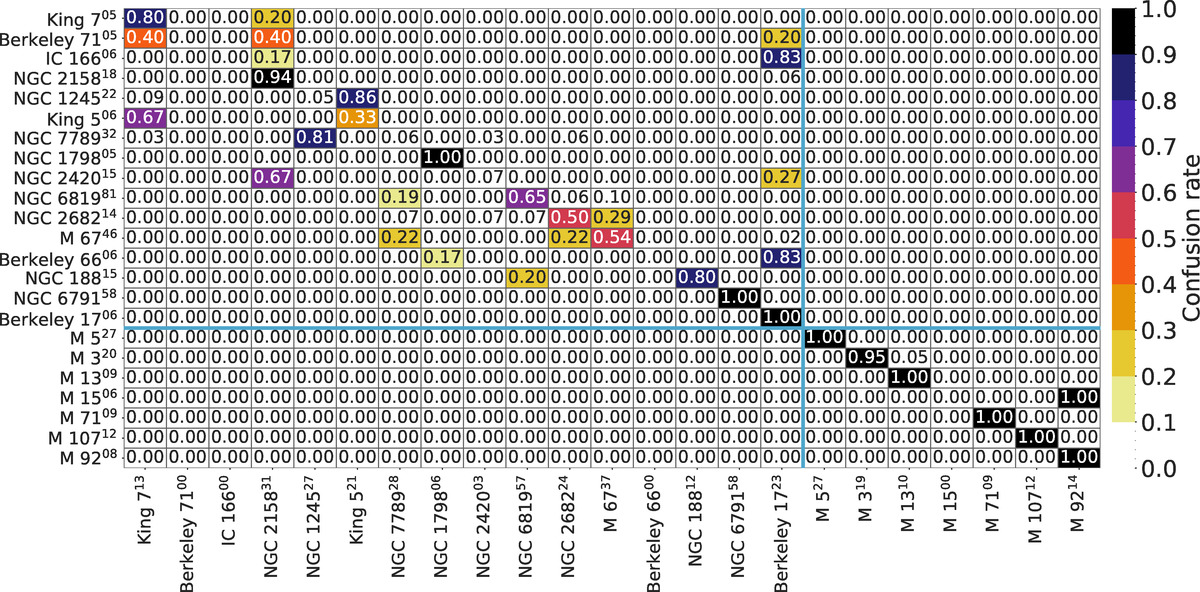
Confusion matrix for our the best classification. The cells are color-coded according to the fraction of stars that are correctly classified as cluster members. The vertical axis corresponds to the real clusters, and the horizontal axis represents the clusters obtained with the mini-batch K-means. The main diagonal shows well-classified objects, and the cells out of the diagonal represent misclassifications.
Current usage metrics show cumulative count of Article Views (full-text article views including HTML views, PDF and ePub downloads, according to the available data) and Abstracts Views on Vision4Press platform.
Data correspond to usage on the plateform after 2015. The current usage metrics is available 48-96 hours after online publication and is updated daily on week days.
Initial download of the metrics may take a while.