Fig. A.3.
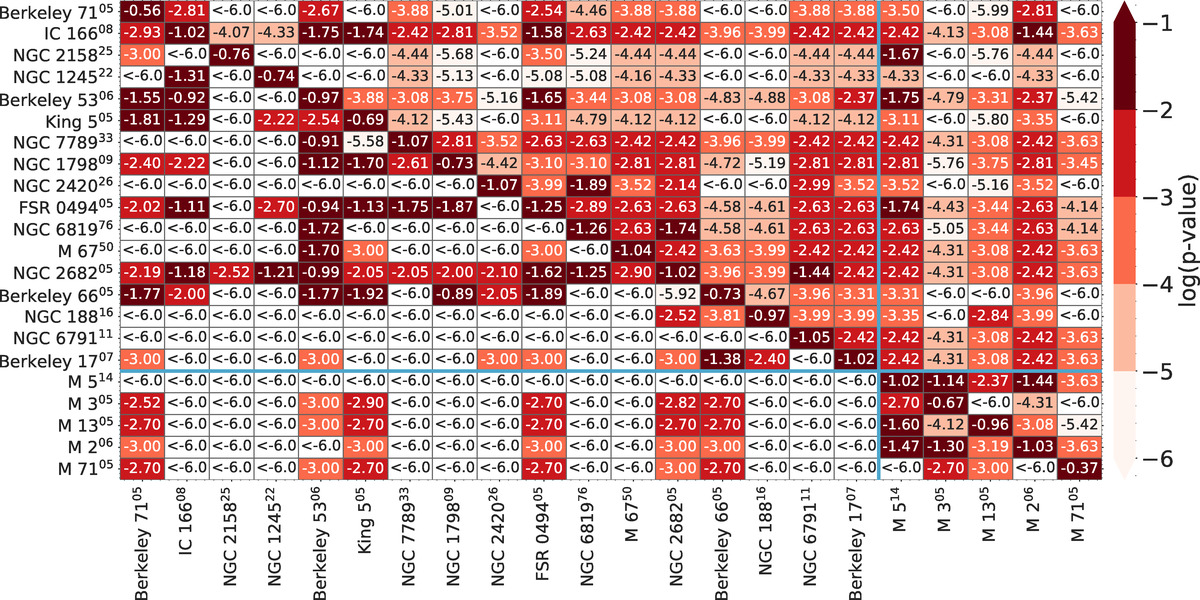
Same as Fig. 4 for the calibrated abundances. Median log p-values of 100 runs of the Cramer two-sample test for each pair of clusters. The elements below the main diagonal show the median value of 100 runs of the Cramer test, and the elements above the diagonal show the results for the K–S test. The cells are colored in shades of red as shown in the color bar. Inside each cell, we show the p-value of the test for each particular pair of clusters. Superscripts in the cluster names indicate the number of stars in the cluster. Two blue lines separate the objects into globular and open clusters.
Current usage metrics show cumulative count of Article Views (full-text article views including HTML views, PDF and ePub downloads, according to the available data) and Abstracts Views on Vision4Press platform.
Data correspond to usage on the plateform after 2015. The current usage metrics is available 48-96 hours after online publication and is updated daily on week days.
Initial download of the metrics may take a while.