Fig. 4.
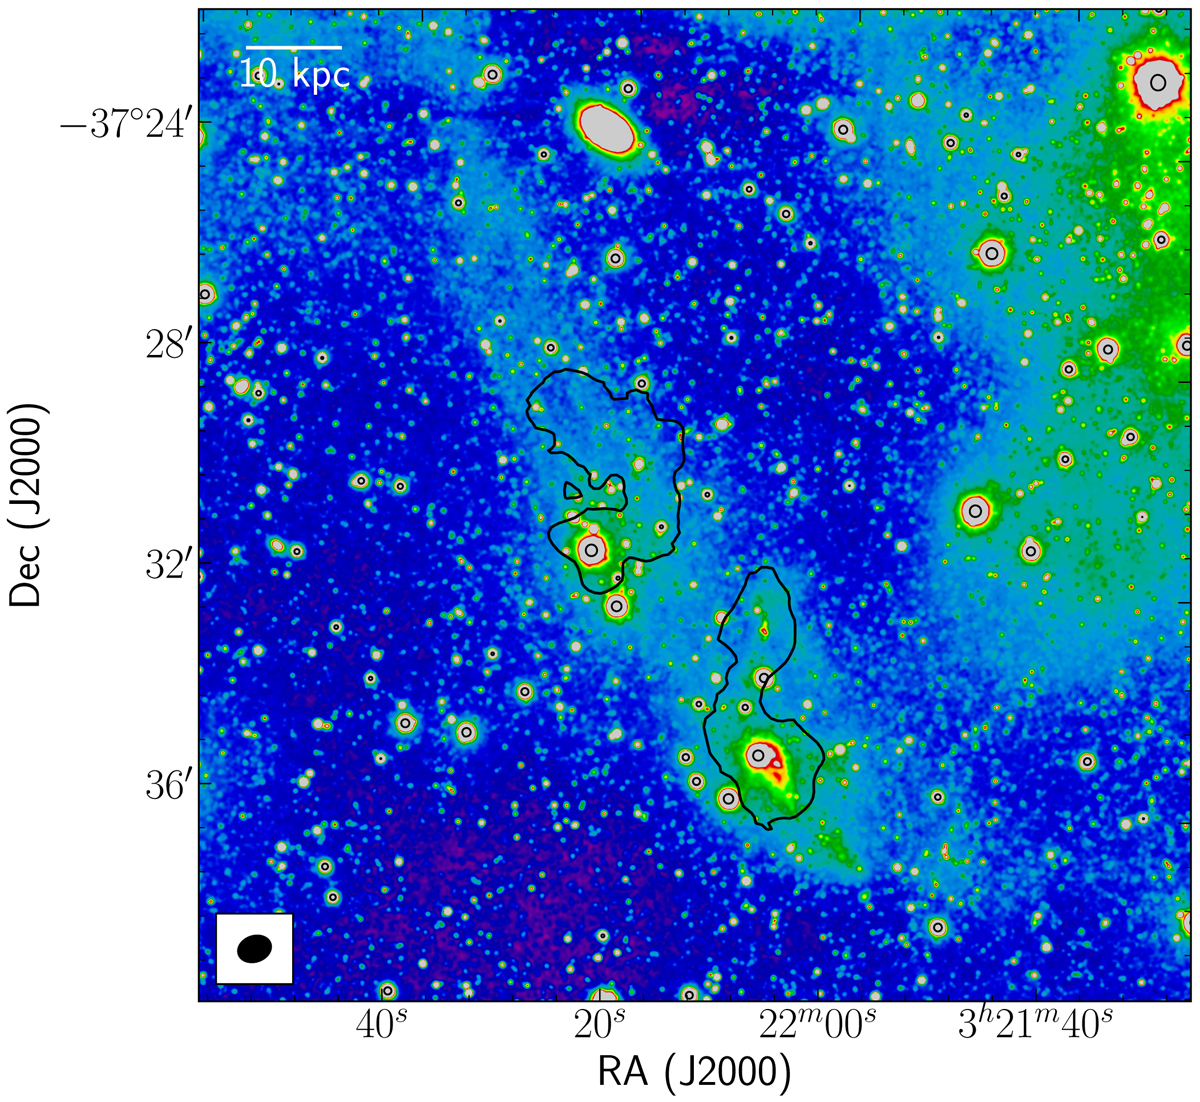
Relation between the H I tail TS and the optical tidal feature L5. The image shows a single H I contour at a column density of 2.7 × 1019 cm−2 (black) overlaid on a stack of the g-, r- and i-band images from the Fornax Deep Survey (Iodice et al. 2017) shown in false colour with a linear stretch. The optical image was convolved with a 4″ Gaussian (FWHM). The black circles indicate bright foreground stars. The H I Gaussian restoring PSF in the bottom-left corner has a FWHM of 36.7″ × 28.1″ and position angle 109 deg. The scale bar in the top-left corner represents 10 kpc (∼100″ at a distance of 20 Mpc).
Current usage metrics show cumulative count of Article Views (full-text article views including HTML views, PDF and ePub downloads, according to the available data) and Abstracts Views on Vision4Press platform.
Data correspond to usage on the plateform after 2015. The current usage metrics is available 48-96 hours after online publication and is updated daily on week days.
Initial download of the metrics may take a while.