Fig. 2.
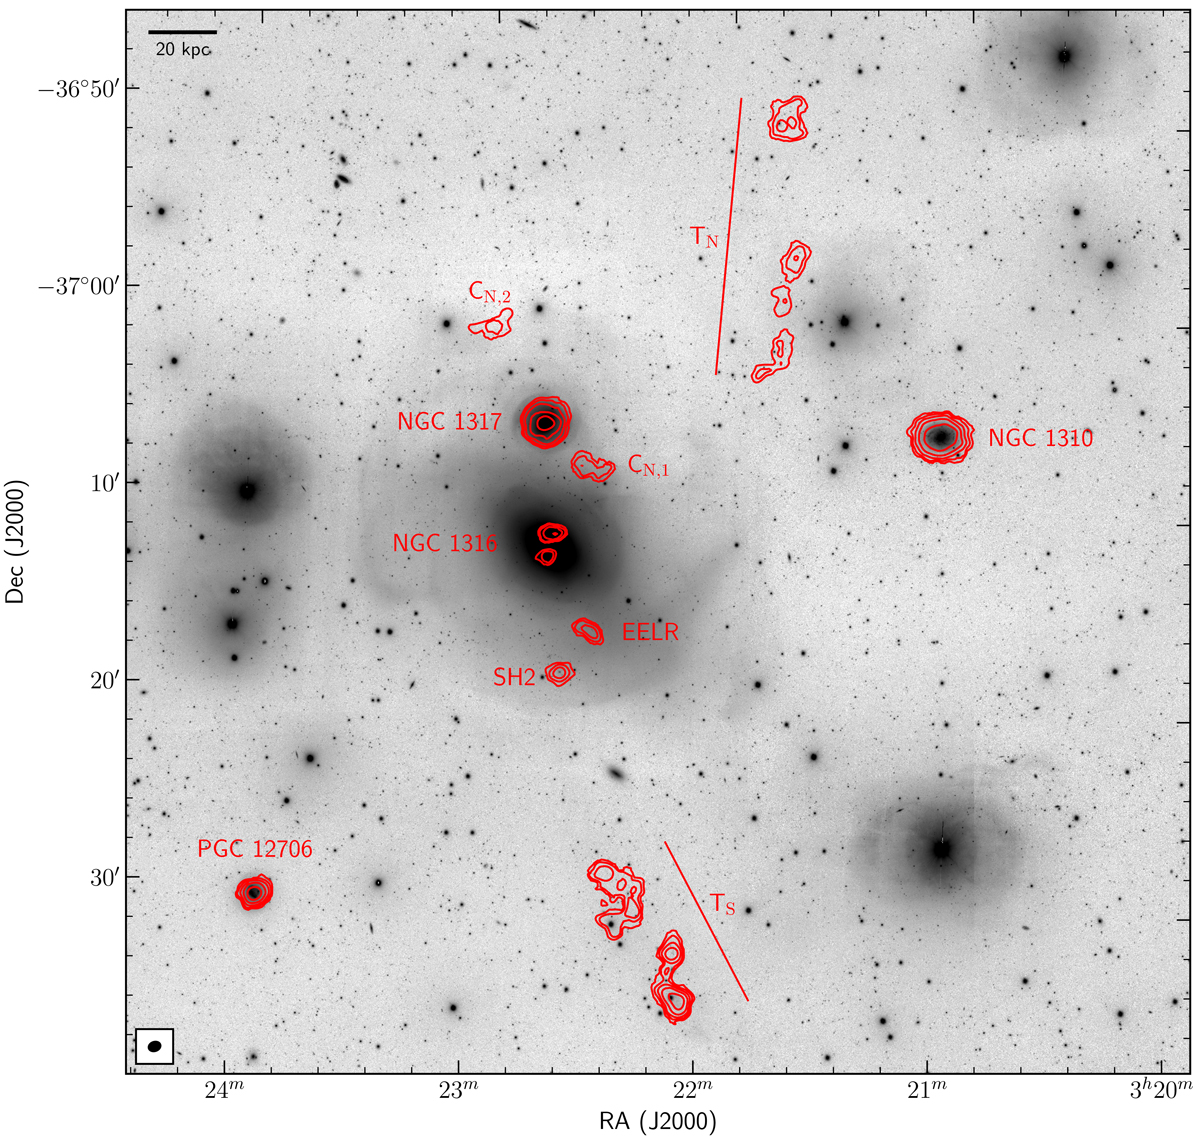
Primary-beam corrected, constant column density H I contours overlaid on a r-band image from the Fornax Deep Survey (Iodice et al. 2017). The contour levels are 2.7 × 1019 × 2n cm−2 (n = 0, 1, 2, ...). The lowest contour corresponds to a 3σ signal in a single channel at the centre of the H I cube (coincident with NGC 1316) but has lower significance further out. The Gaussian restoring PSF in the bottom-left corner has a FWHM of 36.7″ × 28.1″ and position angle 109 deg. The scale bar in the top-left corner represents 20 kpc (∼3.5′ at a distance of 20 Mpc). The H I properties of the labelled sources are listed in Table 2.
Current usage metrics show cumulative count of Article Views (full-text article views including HTML views, PDF and ePub downloads, according to the available data) and Abstracts Views on Vision4Press platform.
Data correspond to usage on the plateform after 2015. The current usage metrics is available 48-96 hours after online publication and is updated daily on week days.
Initial download of the metrics may take a while.