Fig. 1.
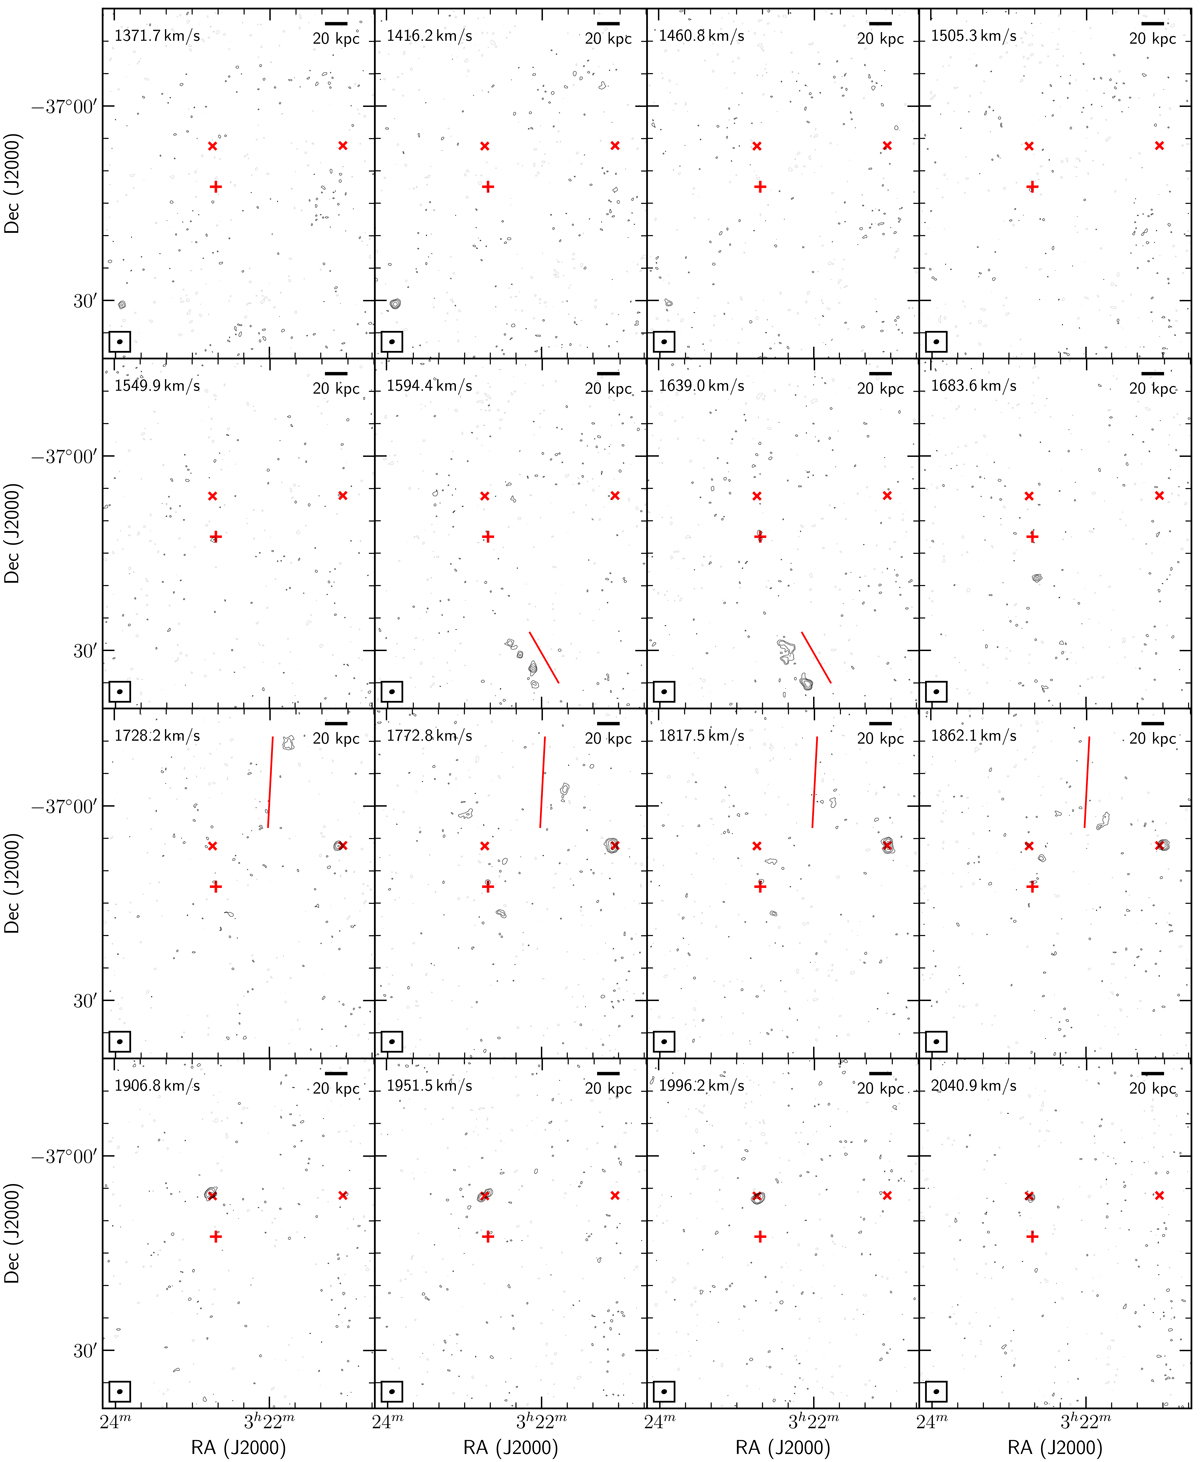
Selected consecutive channel maps extracted from the H I data cube of the NGC 1316 region obtained from the MeerKAT data. The figure shows channels in the recessional velocity range where we detect H I. We list the velocity of each channel in the top-left corner. Velocities are in the barycentric reference frame (optical definition). The contour levels are −0.5 mJy beam−1 (grey dotted) and 0.5, 1, 2, 4, 8 mJy beam−1 (black solid; for reference, the noise is 0.19 mJy beam−1). The Gaussian restoring PSF in the bottom-left corner has a FWHM of 36.7″ × 28.1″ and position angle 109 deg. The scale bar in the top-right corner represents 20 kpc (∼3.5′ at a distance of 20 Mpc). The red “+” marker represents the centre of NGC 1316. The two red “x” markers represent NGC 1317 (east) and NGC 1310 (west), respectively. The two red lines represent (and are drawn slightly offset from) the new, large-scale H I tails TS (south) and TN (north) in the channels where we detect them (see Sect. 3).
Current usage metrics show cumulative count of Article Views (full-text article views including HTML views, PDF and ePub downloads, according to the available data) and Abstracts Views on Vision4Press platform.
Data correspond to usage on the plateform after 2015. The current usage metrics is available 48-96 hours after online publication and is updated daily on week days.
Initial download of the metrics may take a while.