| Issue |
A&A
Volume 628, August 2019
|
|
|---|---|---|
| Article Number | A81 | |
| Number of page(s) | 15 | |
| Section | Catalogs and data | |
| DOI | https://doi.org/10.1051/0004-6361/201935752 | |
| Published online | 09 August 2019 | |
Strongly magnetic Ap stars in the Gaia DR2 Hertzsprung-Russell diagram⋆
I. Selecting the most reliable astrometric and photometric data
1
Leibniz-Institut für Astrophysik Potsdam, An der Sternwarte 16, 14482 Potsdam, Germany
e-mail: This email address is being protected from spambots. You need JavaScript enabled to view it.
2
Apache Point Observatory and New Mexico State University, PO Box 59, Sunspot, NM 88340-0059, USA
Received:
23
April
2019
Accepted:
18
June
2019
Abstract
Context. Knowing the distribution of strongly magnetic Ap stars in the Hertzsprung-Russell diagram (HRD) allows us to study the evolution of their magnetic fields across the main sequence (MS). With a newly extended Ap star sample from APOGEE and available Gaia DR2 data, we can now critically review the results of previous studies based on HIPPARCOS data.
Aims. To investigate our targets in the Gaia DR2 HRD, we need to define astrometric and photometric quality criteria to remove unreliable data from the HRD.
Methods. We used the Gaia DR2 renormalised unit weight error RUWE as our main quality criterion. We considered known (close) binaries in our sample compared to their (partly affected) astrometry and used the Gaia DR2 data to find common parallax and proper motion (CPPM) wide companions and open cluster members. We studied G, BP, and RP variability amplitudes and their significance as a function of magnitude. In colour-magnitude diagrams (CMDs) with absolute G magnitude (determined from inverted parallax) versus BP − RP colour and HRDs, where BP − RP is replaced by effective temperature, we studied the appearance of outliers with respect to their astrometric quality, binarity, and variability.
Results. We present a catalogue of 83 previously known and 154 new strongly magnetic Ap stars with Gaia DR2 data, including astrometric quality parameters, binary flags, information on cluster membership, variability amplitudes, and data from HIPPARCOS. Our astrometrically cleaned subsamples include 47 and 46 old and new Ap stars with parallaxes > 2 mas. Most of the known 26 binaries among all 237 stars and 14 out of 15 CMD/HRD outliers were excluded by astrometric criteria. The remaining 11 known binaries and a few highly variable objects mainly appear in the bright and red CMD/HRD parts. A CMD based on HIPPARCOS photometry and Gaia DR2 parallaxes shows a much more narrow distribution in the absolute V magnitudes of 75 common Ap stars over the full B − V colour range than the corresponding CMD based on HIPPARCOS parallaxes.
Key words: catalogs / binaries: general / stars: distances / Hertzsprung-Russell and C-M diagrams / stars: magnetic field / stars: variables: general
The catalogue described in Table 1 is only available at the CDS via anonymous ftp to cdsarc.u-strasbg.fr (130.79.128.5) or via http://cdsarc.u-strasbg.fr/viz-bin/qcat?J/A+A/628/A81
© ESO 2019
1. Introduction
Although they are expected to have radiative envelopes, chemically peculiar Ap and Bp stars (Babcock 1958; Preston 1974; Moss 2001) are the most magnetic non-degenerate stars, with surface field strengths up to 34 kG that average to about 7 kG (Babcock 1960; Chojnowski et al. 2019). The observed chemical peculiarities in Ap stars, that is, overabundances of iron-group and rare-earth elements, are caused by the strong magnetic fields that interrupt normal diffusion processes. A small group of 238 Ap stars (of many thousand known) are known to be sufficiently magnetic and slowly rotating for individual Zeeman split components of absorption lines to be resolved with moderate- to high-resolution spectroscopy, permitting unambiguous measurement of the mean magnetic field modulus (Mathys 2017; Chojnowski et al. 2019). Considering that the mechanism(s) by which Ap stars attain such strong magnetic fields remains poorly understood, the highly magnetic slowly rotating subsample provides an important testbed to improve our understanding of magnetic field generation in the absence of a surface convection zone.
The first study of the evolutionary state of a sample of strongly magnetic Ap stars with accurate HIPPARCOS parallaxes (ESA 1997) indicated that their distribution in the Hertzsprung-Russell-diagram (HRD) differs from that of the normal stars in the same temperature range at a high level of significance (Hubrig et al. 2000, 2007). While Bp stars with masses M > 3 M⊙ were found to be concentrated closer to the zero-age main sequence (ZAMS) (Hubrig et al. 2007; Briquet et al. 2007), Ap stars with masses M < 3 M⊙ are already evolved from the ZAMS and are concentrated towards the centre of the main sequence (MS) band. According to Hubrig et al. (2007), stronger magnetic fields tend to be found in hotter, younger, and more massive stars, as well as in stars with shorter rotation periods. Furthermore, it was shown that the magnetic flux remained constant over the stellar lifetime on the MS.
The availability of the second data release (DR2) of Gaia (Gaia Collaboration 2018b) now allows us to determine the evolutionary state of magnetic Ap stars, the evolution of their magnetic fields across the MS, and possible correlations between evolutionary state and stellar properties with more reliability than before. Knowing evolution of the magnetic field is essential for understanding the physical processes taking place in these stars and the origin of their magnetic fields. We here exclusively consider the distribution in the HRD of stars for which strong surface magnetic fields are already detectable in unpolarized light. Such stars have low projected rotational velocities and possess strong kilogauss magnetic fields that are measured using the spectral lines resolved into their magnetically split components.
A sample of 84 previously known Ap stars with measured mean magnetic field moduli using optical observations was listed in Mathys (2017). Opposite to the mean longitudinal magnetic field (i.e. the average over the visible stellar hemisphere of the line-of-sight component of the magnetic vector determined from the analysis of the circular polarisation of spectral lines), the mean magnetic field modulus is rather insensitive to the geometry of the observation. Using near-infrared (NIR) H-band spectra of about 900 Ap stars provided by the Sloan Digital Sky Survey (SDSS)/Apache Point Observatory Galactic Evolution Experiment (APOGEE; Majewski et al. 2017) survey, a new sample of 154 stars representing 17% of the total number of observed Ap stars were recently reported to exhibit resolved magnetically split lines (Chojnowski et al. 2019). Chojnowski and collaborators presented the first exploitation of the (NIR) wavelength regime to study magnetic fields in Ap stars, yielding a 183% increase in the number of Ap stars with measured magnetic field moduli and bringing the total to 238 stars.
All these stars together are distributed over the full sky (Fig. 1), where the old and new samples occupy different regions in Galactic longitude. We call the previously known (Mathys 2017) and newly found (Chojnowski et al. 2019) strongly magnetic Ap stars with resolved magnetically split lines throughout the paper “old” and “new” Ap stars and mark them in all corresponding figures with red filled and blue open symbols, respectively. Because of the APOGEE field plan (Zasowski et al. 2013) with a grid of pointings along the Galactic disk, the new Ap stars are clearly more concentrated in the Galactic plane (standard deviation of Galactic latitude ±16 deg) than the old ones (±25 deg). A stronger concentration of the new Ap stars towards the Galactic plane could also be expected because all Ap stars likely belong to the thin-disc population of the Galaxy and the new Ap stars are on average more distant than the old Ap stars (see Sect. 2). The majority of the 238 stars possess magnetic fields in the range of 4–7 kG (Chojnowski et al. 2019). The average for the mean magnetic field modulus for the APOGEE sample is about 7.1 kG, while the average for all stars in the sample of 238 stars including those of Mathys (2017) is slightly higher, about 7.3 kG.
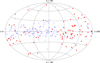 |
Fig. 1. Distribution on the sky (in Galactic coordinates) of the old (red filled symbols, Mathys 2017), and new (blue open symbols, Chojnowski et al. 2019) AP stars. |
Here, in Paper I of a series, we first describe and investigate the available astrometric Gaia DR2 data (Sect. 2) on 237 out of all 238 Ap stars. In Sect. 2.1 we define astrometric quality criteria. In Sect. 2.2 we study the influence of relatively close (in angular separations) companions on the astrometry and report on a search for wide companions around our targets. In Sect. 2.3 we report on a few open cluster members among our targets. A comparison of the Gaia DR2 and HIPPARCOS parallaxes of the Ap stars is given in Sect. 2.4. In Sect. 3 we investigate the variability of our Ap stars compared to all bright stars in three photometric bands of Gaia. Subsequently, we present a first study of the location of all our targets in colour-magnitude diagrams (CMDs; and HRDs) based on Gaia DR2 observational data (and derived physical parameters) (Sect. 4.1) and make a comparison with observational CMDs using HIPPARCOS data (Sect. 4.2). In our preliminary CMD and HRD analysis in Sect. 4 we pay special attention to the astrometric quality, binarity, and variability of our targets. Our main conclusions and an outlook to Paper II are given in Sect. 5.
2. Astrometric reliability of Gaia DR2
Gaia DR2 (Gaia Collaboration 2018b) provided not only parallaxes for an unprecedented number of stars, but also much higher accuracy for the parallaxes and proper motions of relatively bright stars (V ≲ 12 mag) than previously provided by HIPPARCOS (ESA 1997) and in the revised HIPPARCOS catalogue (van Leeuwen 2007). However, Gaia DR2 provided only five-parameter astrometric solutions that do not take possible orbital motions of binaries into account. Therefore, we consider the reliability of the Gaia DR2 astrometric data together with the binarity of our targets in Sects. 2.1, 2.2, and 2.4. The majority of the old Ap stars (53 out of 84) but only 22 of the 154 new ones (see Sect. 1) have previously been observed by HIPPARCOS. Their parallax errors given by van Leeuwen (2007) varied between 0.3 mas for the brighter and 1.9 mas for the fainter stars. The parallax errors in the original HIPPARCOS catalogue (ESA 1997) were generally larger and varied for our Ap stars between 0.5 mas and 2.9 mas.
Except for one of the old Ap stars (HD 168767), we found Gaia DR2 data for all stars in our two samples that are described in Sect. 1. In Fig. 2 we show that the old Ap stars are systematically brighter than the new ones. This is because the new stars on average lie at larger distances than the old ones when we simply compute distances from the inverted Gaia DR2 parallaxes (Fig. 3). Because the sample of new Ap stars is dominated by faint stars (G > 10.5 mag) that are missing in the sample of 84 old Ap stars, and because the binarity of the new stars has not yet been investigated as much as for the previously known stars (see Sect. 2.2), we consider the two samples separately in our analysis. The Gaia DR2 parallax errors of about 80% of the old and 90% of the new stars are smaller than 0.1 mas. Larger errors, comparable to the revised HIPPARCOS errors (between 0.3 mas and a maximum of about 1.0 mas), were reported in Gaia DR2 in only a few exceptional cases.
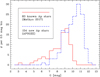 |
Fig. 2. Distribution of Gaia DR2 G magnitudes of old (Mathys 2017) and new (Chojnowski et al. 2019) Ap stars. |
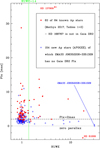 |
Fig. 3. Gaia DR2 parallaxes and RUWE of the astrometric solution for old (red filled symbols) and new (blue open symbols) Ap stars. The solid line marks the allowed maximum (RUWE = 1.4) for well-behaved astrometric solutions (Lindegren 2018). The dotted line indicates zero parallaxes, and the dashed line marks the lower parallax limit of 2 mas that we applied in our selection of the astrometrically most reliable stars (Sect. 2.1). Stars with negative or missing parallaxes, or for which only a lower limit of RUWE could be estimated, are labelled (see text). |
The main astrometric data from Gaia DR2 for 83 of the 84 old and 154 new Ap stars are included in our catalogue of strongly magnetic Ap stars with resolved magnetically split lines available only in electronic form at the CDS. A full description of all catalogue columns is given in Table 1. This catalogue also contains astrometric quality criteria that were not given in the original Gaia DR2, information on the existence of close and wide binary companions (see Sect. 2.2) and open cluster membership (Sect. 2.3), and additional parameters related to photometric quality and possible variability of these objects (Sect. 3) The astrometrically most reliable and non-variable stars in the catalogue are flagged. We use the names of the old Ap stars as given by Mathys (2017) (HD names, except for BD+0 4535), which are all resolved by SIMBAD. We use the 2MASS designations as in Chojnowski et al. (2019) for the new Ap stars. Three of these stars are not yet resolved by SIMBAD: 2MASS J17380465−2146101, 2MASS J17534913−3332308, and 2MASS J18151324+0121014. A summary on all individual objects that are mentioned in the following sections or labelled in figures is provided in Table 2.
Description of the Gaia DR2-based catalogue of 237 strongly magnetic Ap stars with resolved magnetically split lines.
Individual stars mentioned in the text or labelled in figures.
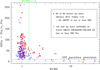 |
Fig. 4. Gaia DR2 ratio of parallax to parallax error as a function of RUWE for old and new Ap stars. The symbols and dotted and solid lines are the same as in Fig. 3. Objects above the dashed line have parallaxes better than 10%. |
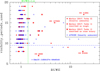 |
Fig. 5. Gaia DR2 number of visibility_periods_used as a function of RUWE. Old and new Ap stars without information on their binarity are plotted as small filled and open symbols, respectively. Stars described by Mathys (2017) as single or close binary stars are plotted with pluses and asterisks, respectively. Only one of the apparently single stars (HD 51684, labelled) has RUWE > 1.4. Two old Ap stars with negative parallax (HD 81009) or with only an estimated lower limit of RUWE (HD 137909) are also labelled, as are the two stars with the lowest number of visibility_periods_used (HD 9996 and 2MASS J18261274−0646548). For our selection of the best-measured stars, we used visibility_periods_used > 9, which is indicated by the dashed line. |
Cluster members in 84 and 154 old and new Ap stars.
2.1. Astrometric quality criteria
We aim to study the distribution of our Ap stars in the HRD, therefore we decided to use criteria on the selection of astrometrically well-measured stars similar to those applied by Gaia Collaboration (2018a) when they built Gaia DR2 HRDs. An estimate of the absolute magnitude in the G band by MG = G + 5log(Plx/100), where Plx is the parallax in milliarcseconds, is according to Gaia Collaboration (2018a) only valid when the relative precision of the parallax is better than about 20%. Therefore, these authors included only stars with an even better relative precision of < 10% in their analysis. In Fig. 4 we show that the majority of our Ap stars fulfil this condition. However, as shown by Lindegren et al. (2018), the relative precision cannot be used as the only criterion for astrometric quality because many nearby sources have a relative parallax precision of < 10% and fall in unexpected regions of the HRD, in particular, between the MS and the white dwarf sequence.
The most important and only recently (after the data release) recommended astrometric quality parameter for Gaia DR2 is the renormalised unit weight error (RUWE) described by Lindegren (2018). This is the newly calibrated unit weight error u, high values of which were suspected by Lindegren et al. (2018) to be caused for example by partially resolved or astrometric binaries. We here use the term “close binaries” for all physical double stars that are unresolved by Gaia (angular separations ≲100 mas) or stars that might be affected by matching problems during the Gaia DR2 data reduction, which occurred at separations ≲1 arcsec (Lindegren et al. 2018). On the other hand, we use the term “wide binaries” for well-measured in Gaia DR2 common parallax and proper motion (CPPM) pairs with separations from a few arcseconds to 1 arcmin. As u is now normalised as a function of both G magnitude and BP − RP colour, the corresponding lookup tables have to be used that are provided at https://www.cosmos.esa.int/web/gaia/dr2-known-issues to calculate the RUWE. The usefulness of the RUWE was demonstrated by Lindegren (2018), in particular for applications like the HRD. The RUWE is now considered a more informative and reliable goodness-of-fit statistics than the parameters listed in the original Gaia DR2, such as astrometric_gof_al or astrometric_excess_noise and its signifcance astrometric_excess_noise_sig. We used the criterion RUWE < 1.4 to select astrometrically well-behaved (single) sources (Lindegren 2018).
Figure 4 shows that our Ap stars with very large RUWE have also larger parallax errors than their parallax values and are located below the dashed line that indicates the 10% parallax precision. One of the new Ap stars (2MASS J06352208+3351329) has the largest RUWE (≈31) of all Ap stars and is listed without a parallax in Gaia DR2 (indicated by a lower limit of zero in Figs. 3 and 4). For comparison, we checked the fraction of stars with RUWE > 1.4 in the about 3 million Gaia DR2 stars with G < 12 mag and measured BP and RP photometry. Almost all of them have five-parameter astrometric solutions, and only about 250 000 (≈8%) of them have RUWE > 1.4, indicating bad astrometric quality. Gaia DR2 did not provide parallaxes and proper motions for only about 27 000 of the 3 million bright stars. The vast majority (≈91%) of these have RUWE > 1.4 (most of which even have RUWE > 40 and would fall outside the range shown in Figs. 3 and 4), which confirms their problematic astrometric measurements. Some of our Ap stars, which mostly lie in the same magnitude interval, have very high ratios of the parallax to the parallax error (from 10 up to 80!), but large RUWE (note the logarithmic scale in Fig. 4). This demonstrates that a good relative parallax precision is not sufficient for selecting objects with reliable astrometry. One of the suspicious objects is HD 137909, which is so bright (G ≈ 3.4 mag) that it falls outside the range of the RUWE lookup tables, and we were only able to estimate a lower limit of 4.8 for its RUWE. The old Ap stars have higher parallax-to-parallax error ratios on average than the new ones, which is mainly due to the systematically smaller parallaxes of the latter.
As a possible additional criterion for selecting the most reliable Gaia DR2 parallaxes and proper motions, the number of visibility_periods_used (also called Np) in the astrometric solution can be used. This corresponds to the number of groups of observations during the 22 months of observations used for DR2 separated from other groups by a gap of at least four days. The reliability of the five-parameter astrometric solutions is higher for observations that are well spread out in time. While the lowest allowed number for objects with given parallaxes and proper motions in Gaia DR2 is visibility_periods_used = 6, a higher number of visibility_periods_used > 8 was preferred, for instance, by Gaia Collaboration (2018a) in their study of Gaia DR2 HRDs. To selecte the best-measured of our Ap stars, we decided to use a slightly more stringent lower limit of visibility_periods_used > 9.
Our final criteria for the most reliable astrometric data are listed below.
-
Parallaxes larger than 2 mas
-
A parallax precision better than 10% (parallax ratio RPlx > 10)
-
RUWE < 1.4 (well-behaved astrometric solutions)
-
visibility_periods_used > 9 (increased parallax reliability)
With these criteria, we selected 47 out of the 83 old and 46 out of the 153 new Ap stars with available Gaia DR2 parallaxes. Fourteen of the excluded 35 old stars have parallaxes below 2 mas, only three with RPlx < 10, 16 stars have RUWE > 1.4 (or not available), and 13 have visibility_periods_used < 10 (eight stars were excluded by more than one criterion). The corresponding numbers for the 108 excluded new stars were 98, 8, 16, and 16 (20 stars were excluded by more than one criterion). With the first selection criterion we reduced the sample size of the new stars by more than 60% and effectively gained a similar distribution with G magnitudes and parallaxes as for the sample of the old Ap stars. Subsequently, the third and fourth criteria on the RUWE and visibility_periods_used played the main role in the selection. In our catalogue we list not only our four individual astrometric quality criteria, but also provide an astrometric quality flag af with values between 0 and 4 equivalent to the number of criteria that a star failed. We also included in our catalogue the unit weight error u (Lindegren et al. 2018) that was widely used in the literature before the RUWE was shown to be a better criterion (Lindegren 2018). Interestingly, one of the regions in the CMD where the advantage of using RUWE instead of u was demonstrated was the upper MS region that contains our Ap stars (see Fig. 13 of Lindegren 2018).
2.2. Binarity
Mathys (2017) provided information on binarity for the subsample of 43 stars from his Table 1, which we show in Fig. 5 with larger symbols and that are marked in our catalogue with the binary flag bf = 1. In his Table 18, he presented 21 of these 43 stars with orbital periods, and he mentioned one more spectroscopic binary (HD 208217) in his text. The orbital periods are mostly in the range of hundreds or thousands of days. Only two stars are listed with orbital periods shorter than 100 days (HD 55719 with ≈46 d and HD 61468 with ≈27 d). At the typical distances of several hundred parsecs, most of these binaries can be considered as close binaries in view of Gaia because their expected maximum angular separations estimated for a circular orbit are typically smaller than 0.1 arcsec.
Only for the two relatively nearby (distances of only 30−35 pc) known binaries with long orbital periods, HD 137909 with ≈3858 d and HD 201601 with 100 200 d, could the angular separations be larger, of the order of 0.2 arcsec and 1.7 arcsec, respectively. With our search for CPPM-wide binary companions (see below), we failed to find a corresponding companion around HD 201601 because Gaia DR2 does not include any other object within about 30 arcsec. On the other hand, the HIPPARCOS and Tycho catalogues on double and multiple star data (ESA 1997) list a companion at a separation of about 1.3 arcsec. The very bright star HD 137909 has been mentioned with respect to its problematic astrometry (RUWE). The star HD 201601 was listed by Mathys (2017) as a visual binary, for which he did not observe radial velocity variations. This is also one of the brightest stars in our sample. The star with the second largest orbital period listed in Table 18 of Mathys (2017), HD 81009 with Porb = 10 700 d, is relatively bright but according to its HIPPARCOS parallax (van Leeuwen 2007) lies at a distance of about 145 pc, corresponding to an estimated maximum angular separation of this long-period companion of about 0.1 arcsec. Gaia DR2 gives only a negative parallax for HD 81009 (=Hip 45999) and lists an 11th magnitude star, without parallax and proper motion, that is separated by only about 1.9 arcsec from HD 81009. If this were associated, it would be an additional very wide companion with an expected very long orbital period of about 2500 years. Figure 5 shows only one star (HD 51684) with a large RUWE that was investigated for binarity but is not listed as a binary by Mathys (2017). This star (=Hip 33375) was found by HIPPARCOS (see also Sect. 2.4) to have an ≈2 mag fainter companion at a separation of only 0.3 arcsec, however, which explains the large RUWE in Gaia DR2.
Using its central J2000 coordinates as provided by SIMBAD and a search radius of 60 arcsec (corresponding to 6000 AU at a distance of 100 pc), we searched for wide companion (CPPM) stars around each Ap star in the Gaia DR2 catalogue. In a first run, CPPM pairs were selected among objects with a parallax precision better than 20% if the ratio of the parallax of the companion candidate to the parallax of the target was in the range of 0.8−1.2 (i.e. the parallaxes also agreed to within 20%) and the differences in the proper motion components were smaller than eight times the sum of their errors. In a second step, only those CPPM candidates were finally accepted as wide companion candidates for which the parallax ratio was in the range 0.88−1.12 (corresponding to a parallax agreement within 12%) and both proper motion components agreed to within 2 mas yr−1. We did not use other astrometric quality criteria than the 20% parallax precision for the individual components of a CPPM pair.
With the required agreement in the parallax and proper motions of the CPPM components, we finally found 26 wide companion candidates around 84 and 154 Ap stars. Their parallax ratios and proper motion differences as a function of the maximum RUWE of the two stars in a CPPM pair are presented in Fig. 6. This figure shows that compared to our initial CPPM search that comprised 39 candidates, our final selection of 26 wide companion candidates led to more reliable results. Only 3 of the 26 CPPM pairs (12%) of higher quality (better agreement of both parallax and proper motion) include a component with RUWE > 1.4, but the 39 initial CPPM candidates of lower quality contain 15 such pairs (38%), including a component with large RUWE. Although the number of investigated targets for the CPPM companion search was small, the correlation between higher CPPM quality and lower RUWE in a CPPM pair can be considered as confirmation of the recommended RUWE < 1.4 limit for astrometrically well-behaved objects (Lindegren 2018) because the RUWE was not used in the CPPM search.
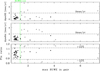 |
Fig. 6. Parallax ratio (bottom) and proper motion differences (upper two panels) as a function of the maximum RUWE in a CPPM pair. Only stars with a parallax precision better than 20% were considered in our search for CPPM stars around 84 and 154 old and new Ap stars (see text). Open and filled symbols show the candidates after our initial and final search criteria, respectively. The dashed lines mark our final CPPM criteria, and the vertical solid line shows the recommended limit of the RUWE for astrometrically well-behaved objects. |
The 26 CPPM companions, which are generally fainter (10 < G < 20 mag) than their primaries and lie at angular separations of 3−60 arcsec, were found around 7 old and 16 new Ap stars with parallaxes between 1.8−7.0 mas and 0.5−4.2 mas, respectively. These stars are marked with a CPPM-wide binary flag wf, corresponding to the number of its CPPM companions, in our catalogue. One new Ap star, 2MASS J06055681+1917131, has two 18th magnitude wide companion candidates, whereas HD 318107 turned out to have even 3 wide companion candidates, including 2 bright (G = 10−11 mag) stars and one 17th magnitude star. All wide companion candidates with a parallax precision of at least 10%, RUWE < 1.4, and visibility_periods_used > 8 can be characterised as MS stars based on their absolute magnitudes and BP − RP colours and based on a comparison with the clean HRDs excluding objects with unreliable parallaxes (cf. Fig. 5 in Gaia Collaboration 2018a) (Fig. 13 in Lindegren 2018).
2.3. Membership in open clusters
Using the new Gaia DR2 results on 1229 open clusters in the Milky Way and their member stars (Cantat-Gaudin et al. 2018), we also determined which of our Ap stars with well-behaved astrometric solutions (RUWE < 1.4) share a CPPM with known clusters and can thus be considered as cluster members with high membership probabilities (≥60% according to Cantat-Gaudin et al. 2018). Interestingly, we found the three wide companion candidates of HD 318107 as well as the primary itself to be members of the open cluster NGC 6405. Another case, where both the Ap star and its wide companion found in our CPPM search within 60 arcsec turned out to be cluster members was the new Ap star 2MASS J03112102+6310394 with a membership in the open cluster Trumpler 3. Two other new Ap stars, 2MASS J17594524+0302056 and 2MASS J18061507+0237308, were found to be members of the same cluster, Collinder 359, whereas one new Ap star, 2MASS J22480641+5906428, has highest membership probabilities (100%) in two clusters, RSG 7 and RSG 8, which were only recently discovered (Röser et al. 2016). One of the old Ap stars, HD 70331, turned out to be a member of the recently discovered open cluster Gulliver 9 reported by Cantat-Gaudin et al. (2018).
In Table 3 we list all cluster members with their membership probabilities Pmemb determined by Cantat-Gaudin et al. (2018), including HD 61513 as a possible member (membership probability of only 40% in the open cluster Haffner 13). We also show in Table 3 the angular distances sep of the Ap stars from the corresponding cluster centres in comparison to the cluster radius r50 (both in degrees) containing half of the members according to Cantat-Gaudin et al. (2018). The two stars located at less than 0.2° from the centres of relatively compact clusters (HD 318107 and 2MASS J03112102+6310394) but also both members of the extended cluster Collinder 359 fall within r50. All other cluster members lie within 2r50 of their corresponding clusters. Our catalogue also provides a cluster membership flag cf, which corresponds to the number of clusters to which the star probably or possibly belongs.
In the search of cluster stars among the new Ap stars, it is important to note that cluster members were often excluded from being targeted as APOGEE telluric standard stars. This is because the survey often intentionally targets the cool or RGB stars in clusters. If two stars are separated by less than 72 arcsec, the fiber casings come into physical contact and the fibers can no longer be plugged into the plug-plate. In this case one of the targets is rejected. To avoid the possibility of telluric stars “colliding out” the cluster science targets, the tellurics are therefore usually not allowed to be within the projected area of the cluster (Zasowski et al. 2013). Table 3 shows that most of the clusters that host one or two of the new Ap stars are rather extended, and two of these clusters were discovered only recently.
Because the overall success rate of finding cluster members among our Ap stars was relatively low, we did not further investigate the few cluster members that we did find. Their host clusters are generally known to be young (≲100 Myr), as reported in the Milky Way Cluster Survey (MWSC) of Kharchenko et al. (2013), for example. Cantat-Gaudin et al. (2018) also referred to the MWSC ages, but mentioned a paper by Bossini et al., (in prep.) on new cluster ages. Based on Gaia DR2 data, these ages might be expected to be more accurate than in the MWSC. However, as these authors state in their meanwhile published paper (Bossini et al. 2019), they were unable to provide more reliable ages for the youngest clusters with their applied method of isochrone fitting because at very young ages, this method is compromised by several problems (problematic MS turn-off identification, contamination by pre-MS stars and possible age spread). We note that Cantat-Gaudin et al. (2018) investigated a much larger sample of 3328 cluster candidates, but only confirmed about one-third of them as real clusters according to the Gaia DR2 data. It is remarkable that the majority of the previously known open clusters in the Milky Way have apparently not “survived” after Gaia DR2. On the other hand, these much more accurate data now allowed for much better membership determination of individual stars in newly found and confirmed clusters. Therefore, previous results based on a “large sample of magnetic Ap stars in open clusters” (see Bailey et al. 2011, and references therein) will certainly need to be reconsidered in view of Gaia.
2.4. Comparison with HIPPARCOS
The one old Ap star that is not included in Gaia DR2 (HD 168767) was not measured by HIPPARCOS either. Among all our Ap stars with available Gaia DR2 data, we identified 53 old and 22 new stars that were previously measured by HIPPARCOS. In particular, all bright Ap stars below a magnitude limit of G < 7.4 mag (23 stars) are present in both catalogues. For all 75 stars in common to both catalogues, we included the most important astrometric and photometric data from the revised HIPPARCOS catalogue by van Leeuwen (2007) in our catalogue. There we preferred to list the HIPPARCOS parallaxes HPlx and their formal errors eHPlx (but not the proper motions) as well as the number of HIPPARCOS field transits Ntr (they may be of similar importance as the Gaia DR2 visibility_periods_used), and some other parameters describing the type (Sn, So) and quality (parameters on the goodness of fit F2 and the percentage of rejected data F1) of the HIPPARCOS astrometric solution. Notes on the HIPPARCOS photometry N and on the measured V magnitudes in the HIPPARCOS system (HPmag) and the colour indices B − V and V − I are also listed.
Except for HD 201601, all objects in common with Gaia DR2 parallax errors larger than 0.2 mas do not satisfy our astrometric criteria either (mainly concerning RUWE, but also other criteria). Interestingly, all these objects (including HD 81009 with a negative Gaia DR2 parallax but a relatively well-measured HIPPARCOS parallax of 6.92 ± 0.61 mas) were described as binaries either by Mathys (2017) or by HIPPARCOS (van Leeuwen 2007). In the latter case, this means that they had non-standard astrometric solutions in the new and old HIPPARCOS reductions (see solution types Sn and So, and the number of components was Nc = 2 (see also Table 1). The binarity of four of seven such HIPPARCOS binaries with Nc = 2 was not reported by Mathys (2017). This concerned three old Ap stars (HD 47009, HD 51684, and HD 158450) and one new Ap star (2MASS J02594527+5419449. On the other hand, three of the HIPPARCOS binaries (HD 55719, HD 81009, and HD 201601 were previously described as binaries by Mathys (2017).
When we consider the parallax differences (excluding HD 81009 with a negative Gaia DR2 parallax) in our HIPPARCOS–Gaia comparison, the 54 Ap stars measured by HIPPARCOS that fulfil the three last of our Gaia DR2 astrometric quality criteria defined in Sect. 2.1 (we also include here objects with parallaxes smaller than 2 mas) show a mean difference of only −0.02 mas with a standard deviation of ±1.20 mas. On the other hand, the 20 stars that do not fulfil at least one of these three criteria (marked as black dots in Fig. 7) show a mean difference of −0.50 mas with a standard deviation of ±1.90 mas (when we include the outlier HD 81009, we have 21 stars with a mean difference of +0.02 mas and an even larger standard deviation of ±3.02 mas). Figure 7 shows the much larger spread of the HIPPARCOS–Gaia DR2 parallax differences for the latter stars (black dots). The formal parallax errors in Gaia DR2 of two of the stars that we exclude with our Gaia DR2 astrometric quality criteria (HD 81009 and HD 137909) exceed those of HIPPARCOS. These two also show the largest parallax differences in Fig. 7. We did not use any astrometric criteria of HIPPARCOS in this comparison, therefore we interpret these results as supporting our required Gaia DR2 astrometric quality criteria, although we are aware of the small number statistics.
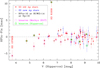 |
Fig. 7. HIPPARCOS–Gaia DR2 parallax differences of old (red filled lozenges) and new (blue open lozenges) Ap stars as a function of the HIPPARCOS V magnitude (HPmag in Table 1). Error bars represent the sum of the errors from both catalogues. Two objects, for which the Gaia DR2 errors were larger than the HIPPARCOS ones, are labelled. Overplotted black dots mark stars that do not fulfil the last three astrometric criteria defined in Sect. 2.1. Magenta open hexagons and green open squares mark stars that were found to be binaries by Mathys (2017) and HIPPARCOS, respectively. |
In Fig. 8 we compare the main astrometric quality criteria from HIPPARCOS and Gaia DR2 for the 75 Ap stars in common. One star (HD 137909) is labelled because we were only able to estimate a lower limit of its RUWE. This very bright star also has the largest HIPPARCOS goodness-of-fit parameter F2 (and the highest percentage of rejected data, F1 = 3). There are only 21 (out of 53) and 7 (out of 22) known binaries among the old (red filled symbols) and new (blue open symbols) Ap stars. With only a few exceptions, all stars with problematic astrometry either in HIPPARCOS (F2 > 3) or Gaia DR2 (RUWE > 1.4) were previously known as binaries from Mathys (2017) or HIPPARCOS.
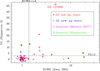 |
Fig. 8. Comparison of the astrometric quality criteria F2 (goodness of fit; see Table 1) from HIPPARCOS (van Leeuwen 2007) and RUWE from Gaia DR2. Values exceeding F2 > 3 (dashed line) and RUWE > 1.4 (solid line) indicate a poor astrometric fit of the HIPPARCOS and Gaia DR2 data, respectively. Magenta open hexagons and green open squares mark known binaries. |
3. Gaia DR2 photometric reliability and variability
The HRD obtained from Gaia DR2 data needs to be cleaned not only based on astrometric but also on photometric quality criteria. Lindegren et al. (2018) demonstrated with their three steps from “Selection A” to “Selection C” that the combined use of astrometric and photometric criteria improved the HRD. Their first photometric criteria included in their “Selection A” concerned a sufficiently high signal-to-noise ratio in the BP and RP bands (phot_bp_mean_flux_over_error > 10 and phot_rp_mean_flux_over_error > 10). These and the other photometric criteria in their “Selection C” concerning the flux excess factor, indicating problems with the photometry of faint objects in crowded fields, are easily fulfilled for all our relatively bright Ap stars.
Only a relatively small subsample of about half a million Gaia DR2 sources (with variability flag “VARIABLE”) was released with detailed (multi-epoch) photometric data and time-series analysis based on these data (Eyer et al. 2018; Holl et al. 2018). The location of a large number of different types of variable stars in the Gaia DR2 HRD was clearly illustrated by Gaia Collaboration (2019); this also included some unpublished Gaia data in the analysis of the variability level and the motion of known variable stars in the Gaia DR2 HRD. In their Fig. 11 they show that these motions for stars in the upper MS region are relatively small and preferentially occur in the same direction as the combined effect of interstellar extinction and reddening (see Fig. 17 in Andrae et al. 2018).
For none of our Ap stars did we find the variability flag set to “VARIABLE”. Nevertheless, as the Gaia DR2 variability flag was given for only a small subset of known variable sources processed so far, this flag was set to “NOT AVAILABLE” for almost all sources, including possibly large numbers of new variable objects and other known variables that can be detected by Gaia. As a first indication on their variability, the occurrence of relatively large errors of the integrated flux measured by Gaia in three passbands can be used.
We used the “variability amplitude”, which can be simply computed from the square root of the number of observations multiplied by the error of the integrated mean flux and divided by the mean flux (see Deason et al. 2017; Vioque et al. 2018). We did this not only for the G-band flux, but also for the integrated fluxes in the Gaia DR2 BP and RP bands. For comparison with typical non-variable sources, we investigated the variability amplitudes in the three passbands of all Gaia DR2 sources, excluding those with variability flags and with RUWE > 1.4, as a function of G magnitude. Despite these exclusions, the distributions of the variability amplitudes still contained very long tails of suspected additional variable stars. Similar to the procedure described by Vioque et al. (2018), we used small 0.1 mag intervals, but instead of mean variability amplitudes and their standard deviations in each G magnitude interval, we applied Gaussian fits to the very asymmetric distributions. We then computed the standard deviation σ from the Gaussian centre as the full width at half maximum (FWHM) devided by the factor of 2.355 (Weisstein 1998) in each magnitude interval, respectively.
In Fig. 9 we show for example the G-band variability amplitudes (va_G) as a function of G magnitudes in the interval 3.5 < G < 13 mag (the bright limit corresponds to the limit for which RUWE tables are available; the faint limit was selected in accordance with the faintest magnitudes of our Ap stars; see Fig. 2). The difference between the simple means and standard deviations in small magnitude bins and the corresponding results from Gaussian fits is obvious. The Gaussian fits helped us to much better distinguish the bulk of typical non-variable objects from the long tails of suspected variables seen in all G magnitude bins.
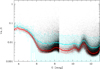 |
Fig. 9. G-band variability amplitude (va_G) of all Gaia DR2 sources with G < 13 mag, excluding those with known variability flags and with RUWE > 1.4, as a function of G magnitude. All objects at G < 8.5 mag but only every 50th object at G > 8.5 mag are plotted as black dots for clarity. Overplotted cyan symbols and error bars show the simple mean values and standard deviations in 0.1 mag wide intervals, whereas red symbols and their error bars show the corresponding results from Gaussian fits. |
As a measure of how significant the variability amplitude of a given object is, we defined the number of standard deviations σ (obtained from the Gaussian FWHM) that lies above the central (typical) value derived from the Gaussian fit at a given G magnitude. To transform the discrete values computed in steps of 0.1 mag to continuous functions of magnitude, we used higher order polynomial fitting for the Gaussian centres and for their standard deviations, respectively. The results of these polynomial fits and the corresponding 3σ levels for the G, BP, and RP variability amplitudes are shown in Fig. 10. While for the G variability amplitudes, 18th-order polynomials were needed to achieve a reasonable fit, in case of the BP and RP variability amplitudes, 12th- and 15th-order polynomials were used, respectively.
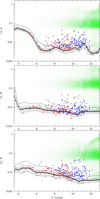 |
Fig. 10. Top: G-band variability amplitudes (va_G) as a function of G magnitude for all objects (3.5 < G < 13 mag) that are flagged as variables in Gaia DR2 (green dots). Black filled squares and error bars show the Gaussian centres and standard deviations computed from the Gaussian FWHM for objects without a variability flag and with RUWE < 1.4, respectively, in each 0.1 mag wide interval. An 18th-order polynomial fit of the Gaussian centres resulted in the black solid line. The black dashed line represents three times of the standard deviations (also obtained from an 18th-order polynomial fit) added. Overplotted are the data for the old (filled symbols) and new (open symbols) Ap stars. Middle: va_B using 12th-order polynomials. Bottom: va_R with 15th-order polynomials. |
The vast majority of the 53 271 objects with Gaia DR2 variability flags “VARIABLE” that fall in the magnitude interval 3.5 < G < 13 mag (plotted as green dots in Fig. 10) clearly lie above our defined 3σ levels of the variability amplitudes. We also show as filled and open symbols our old and new Ap stars, respectively. While the majority of them, in particular all bright ones, lie below the 3σ levels, some Ap stars show relatively clear indications of variability (note the logarithmic scale used to show the very different variability amplitudes). However, we are aware that a highly significant variability amplitude can be caused both by intrinsic variability and by problematic photometric measurements, for instance in crowded regions, where the changing scanning directions with time may play a role, in particular for the BP and RP photometry, which has a much lower spatial resolution than in the G band.
In our catalogue we list the main photometric data from Gaia DR2 together with the derived variability amplitudes in three passbands (va_G, va_B, and va_R) and their determined significance vaGs, vaBs, and vaRs for the old and new Ap stars. A variability flag vf, indicating the number of photometric bands in which the variability amplitude was more than 3σ larger than the typical value of non-variable sources, is also included. For HD 137909, which with its G ≈ 3.4 mag lies outside of the magnitude interval we used in our variability analysis, we set vf = 4.
4. Analysis of colour-magnitude diagrams
In our first analysis of the Ap stars in CMDs and HRDs based on their Gaia DR2 and HIPPARCOS parallaxes and photometry, we considered the location of outliers and their astrometric quality in Gaia DR2. We also took the binarity and variability into account in selecting a clean sample of Ap stars that are suitable for further investigation. A more detailed analysis of the high-quality Ap star sample with respect to theoretical models and different photometric passbands including corrections for extinction and reddening will be part of Paper II.
4.1. Ap stars in Gaia DR2 CMDs and HRDs
The observed Gaia DR2 CMD of all bright stars within 500 pc with absolute magnitudes MG simply computed from inverted parallaxes as a function of BP − RP colour is shown in Fig. 11. A much sharper blue edge of the MS can be observed in the colour interval 0 < (BP − RP) < 1, when only the stars that fulfil all our astrometric quality constraints (Sect. 2.1) are plotted (green dots compared to yellow dots). All our Ap stars, regardless of their astrometric quality, are plotted in Fig. 11 with larger symbols. While all old Ap stars (filled symbols), except for one star, occupy a relatively compact region of the CMD, the new ones (open symbols) show a generally larger spread.
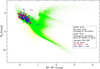 |
Fig. 11. Gaia DR2 CMD for all bright stars (5 < G < 12 mag) with parallaxes > 2 mas (yellow dots). Overplotted as green dots are stars with a parallax precision better than 10% (RPlx > 10) and well-behaved astrometric solutions, i.e. RUWE < 1.4 and an increased number of visibility_periods_used (Np > 9). Filled and open lozenges show all old and new Ap stars with available Gaia measurements (including those with low astrometric quality), respectively. |
Applying our astrometric quality criteria (see above), we selected 47 out of the 82 old and 46 out of the 153 new Ap stars with available positive Gaia DR2 parallaxes. Almost all CMD outliers labelled in the top panel of Fig. 12 did not fulfil our astrometric quality requirements. The one outlier among the old Ap stars, HD 59435, is a known double-lined spectroscopic binary consisting of an Ap star and a G8 or K0 giant and was studied in detail by Wade et al. (1999). Only one of the new Ap stars, 2MASS J07390490+4711571 with RUWE ≈ 1.36, very close to our selection limit, is still seen as an outlier located left of the blue MS edge in the bottom panel of Fig. 12, where we show the high-quality Ap stars. The Ap stars of high astrometric quality still include ten binaries with binary flags bf = 1 (from Mathys 2017) and one new Ap star 2MASS J02594527+5419449 that is treated as double star (Nc = 2) by HIPPARCOS. As expected, all these appear relatively bright in MG and/or red in BP − RP in the bottom panel of Fig. 12.
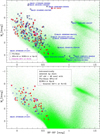 |
Fig. 12. Top: zoom into the high-quality Gaia DR2 CMD of bright stars (5 < G < 12 mag) with parallaxes > 2 mas, RPlx > 10, RUWE < 1.4, and Np > 9 as green dots. As in Fig. 11, all our old and new Ap stars are shown as filled and open lozenges, respectively. In addition, we indicate Ap stars with parallaxes < 2 mas with open squares, and those with problematic astrometry (RPlx < 10 or RUWE > 1.4 or Np < 10) with small filled circles. Binaries (according to Mathys 2017 (bf = 1) or HIPPARCOS (Nc = 2)) are overplotted as large open hexagons. Obvious outliers are labelled with their names (see text). Bottom: only 47 (of 82) old and 46 (of 153) new Ap stars remain after our astrometric quality criteria are applied. One remaining CMD outlier that falls below the blue MS edge is labelled. |
The influence of photometric variability according to our analysis in Sect. 3 is demonstrated in Fig. 13, where we show our two full subsamples (top) of old and new Ap stars and the two astrometrically cleaned subsamples (bottom). We overplot vertical bars of four different sizes for the Ap stars for which the significance of the variability amplitudes in the G band vaGs was in the ranges 3−9, 9−15, 15−21, or larger than 21 (up to a maximum of about 33), respectively. Similarly, we overplot horizontal bars for the stars for which at least one of variability amplitudes in the BP or RP band showed such high significances (with maximum values of about 45). In general, the strongest (red and bright) CMD outliers that are labelled in the top panel of Fig. 12 do not necessarily show up as highly significant variables. Our astrometric selection shown in the bottom panels of Figs. 12 and 13 very effectively excluded all strong CMD outliers, except for the single blue outlier 2MASS J07390490+4711571. Similar to the known binaries that remain after our astrometric selection, the few remaining most variable sources (with large bars in both directions) appear to be concentrated at the red and bright edges of the distribution shown in the CMD (bottom panel of Fig. 13).
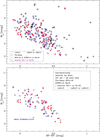 |
Fig. 13. Top: CMD with all our old and new Ap stars as filled and open lozenges, respectively, with the same symbols overplotted for the more distant, astrometrically less reliable, and known binary objects as in Fig. 12. For clarity, the outliers are not labelled and the high-quality stars in the background are omitted. The overplotted vertical bars of different sizes indicate objects with highly significant G-band variability amplitudes, and horizontal bars show the objects with the most significant variability in the BP- or RP-band (see text). Bottom: same after astrometric selection. |
Although the sample sizes and distributions in the CMD of our astrometrically cleaned samples of old and new Ap stars appear similar to each other (bottom panel of Fig. 12), there are remarkable differences in the significance of their variability amplitudes. Of the 47 astrometrically selected old stars, only 3 have (vaGs > 3 AND vaBs > 3 AND vaRs > 3), and 13 have (vaGs > 3 OR vaBs > 3 OR vaRs > 3), whereas the corresponding numbers of the 46 new Ap stars are with 10 and 31 stars, respectively, more than two times higher (see also bottom panel of Fig. 13). We speculate that this discrepancy may be caused by the different distribution of the two samples on the sky (Fig. 1) and the stronger crowding problems expected from the higher concentration of the new Ap stars towards the Galactic plane.
The Gaia DR2 provided effective temperature estimates (in the range 3000−10 000 K) for all bright sources (G < 17 mag), including all our Ap stars, as described by Andrae et al. (2018). They also computed luminosities Lum using the inverted Gaia DR2 parallaxes and a bolometric correction. These authors noted that they assumed zero or at least low extinction in their effective temperature and luminosity estimations. However, as the synthetic stellar spectra used for the bolometric correction covered only the range 2500−8000 K, no Gaia DR2 luminosities are available for hotter stars (Teff > 8000 K). We included the Gaia DR2 effective temperatures Teff together with their lower (b_Teff) and upper (B_Teff) uncertainty limits, as well as the Gaia DR2 luminosities Lum for the cooler Ap stars, in our catalogue. In the HRDs shown in Figs. 14 and 15, we replaced the BP − RP colours used in the CMDs shown in Figs. 11 and 12 by the effective temperatures. Most of the outliers of the CMD in the top panel of Fig. 12, which are also marked in the HRD shown in the top panel of Fig. 15, can also be considered as outliers in this diagram. One additional outlier, HD 137909, which fell well within the bulk distribution in the upper panel of Fig. 12, is marked in the top panel of Fig. 15. This is by far the brightest of our Ap stars and a known binary (see Sects. 2.1, 2.2, and 3). As the Gaia DR2 effective temperatures were estimated assuming zero or low extinction, some of the new Ap stars appear to be much cooler than expected from their classification using APOGEE spectra (Chojnowski et al. 2019). This concerns in particular the seven objects with the apparently coolest Teff < 6200 K of the labelled outliers in the upper panel of Fig. 15. We exclude them all by our astrometric criteria, as shown in the lower panel of Fig. 15. However, uncertain parallaxes only affect the absolute magnitudes. Effective temperatures lower than expected for Ap stars may be due to strong extinction and reddening or to unresolved luminous red companions, such as the G8 or K0 giant we mentioned previously around the old Ap star HD 59435 that appears to have Teff ≈ 6200 K.
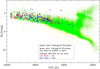 |
Fig. 14. Same as Fig. 11, where the BP − RP colour has been replaced by the Teff that is also provided in Gaia DR2 (Andrae et al. 2018). |
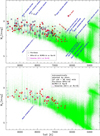 |
Fig. 15. Same as Fig. 12, with all Ap stars in the top and the remaining Ap stars after our astrometric selection in the bottom panel, where the BP − RP colour has been replaced by the Teff that is also provided in Gaia DR2 (Andrae et al. 2018). Except for HD 137909 (see text), the marked objects are the same as labelled in Fig. 12 as outliers. |
As expected, there is a strong correlation between the measured BP − RP colours of our Ap stars and their determined Teff in Gaia DR2 (Fig. 16). However, the nearly linear relationship for the relatively blue objects with BP − RP < 0.6 shows a large scatter. In the colour range 0.2 < BP − RP < 0.6, the Teff distribution is narrower for the old Ap stars, and the new Ap stars, which are on average located at larger distances, appear systematically hotter. For the few redder objects, which predominantly consist of relatively distant new Ap stars, we observe a flattening and less scatter of the linear relationship. Among the labelled five outliers we observe a remarkable concentration of three outliers (HD 70331, HD 200311, and 2MASS J21090244+4844449) at the blue end. We assume that the effective temperatures of these objects were underestimated because the training sample used by Andrae et al. (2018) did not contain stars hotter than 10 000 K. All these three objects fulfilled the last three of our astrometric quality criteria (Sect. 2.1), but the other two outliers labelled in Fig. 16 (the already often mentioned HD 137909 and 2MASS J18151324+0121014) did not (marked with black dots in Fig. 16).
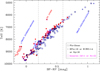 |
Fig. 16. Gaia DR2 effective temperatures and BP − RP colours of old (red filled lozenges) and new (open blue lozenges) Ap stars. The overplotted black open squares and dots mark the most distant and astrometrically problematic objects (Sect. 2.1), respectively. In the colour range 0.2 < BP − RP < 0.6 (between the dashed lines), new Ap stars show a larger scatter and systematically hotter Teff. The slope of the approximately linear relationship becomes flatter at BP − RP > 0.6. |
The absolute magnitudes MG (computed using the inverted parallaxes) show an almost linear relationship with the logarithmic Gaia DR2 luminosities of our cooler Ap stars (see Fig. 17). After using all Ap stars with available luminosities (45 old and 77 new ones) for a linear fit, the old Ap stars show smaller residual differences MG − MG(fit) (with a maximum at about +0.04 mag for HD 177268) than the new ones, which are slightly more spread out and reach maximum deviations at low luminosities (2MASS J18171434+0013052 with a difference of about +0.05 mag, and 2MASS J18261274−0646548 reaches +0.10 mag). Compared to the other objects, 2MASS J18261274−0646548 can be considered as an outlier. This star has previously been found to have the lowest number of visibility_periods_used (Fig. 5). Because of the generally small deviations that can be observed in Fig. 17, we see almost no differences in HRDs (not shown here), where the absolute magnitudes are replaced by the logarithmic luminosities, except for the lacking hot stars at Teff > 8000 K. One of the apparently coolest (Teff ≈ 5060 K) new Ap stars, 2MASS J16241403−4044107, has no luminosity in Gaia DR2 either. This star has a very large RUWE = 9.7 and a small parallax, less than three times larger than its error (RPlx = 2.9). Similar to three apparently hotter new Ap stars with the least significant parallaxes (RPlx < 3) in Gaia DR2 (2MASS J03001958+4355254, 2MASS J07175283+1347078, and 2MASS J20191831+2354023), we suspect that these stars are unresolved binaries.
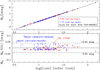 |
Fig. 17. Top: Gaia DR2 absolute magnitudes MG of all Ap stars with Teff < 8000 K as a function of the logarithm of their luminosities Lum. The black line represents a linear fit. Bottom: residual differences beween the MG and their fitted values MG(fit). Objects with absolute differences larger than 0.04 mag (dashed lines) are marked by their names. |
It is remarkable that all four of the reddest Ap stars (also labelled as outliers in the right part of the upper panel of Fig. 12) seem to have problematic Gaia DR2 physical parameters. Three of them appear as outliers in the Teff − BP − RP (Fig. 16) relation (2MASS J18151324+0121014) or in the MG–Lum (Fig. 17) relation (2MASS J18171434+0013052 and J18261274−0646548). The fourth is 2MASS J16241403-4044107, mentioned previously, which has no Gaia DR2 luminosity.
4.2. Ap stars in HIPPARCOS CMD
We also used the HIPPARCOSB, V photometry combined with the Gaia DR2 parallaxes to draw an MV versus B − V CMD (top panel of Fig. 18). The absolute V magnitudes were computed as MV = HPmag + 5log(Plx/100), where Plx were the Gaia parallaxes in microarcseconds. The distribution of the 74 stars in common with positive Gaia DR2 parallaxes (HD 81009 is not shown because its parallax is negative) appears to be rather narrow in MV. It becomes even narrower when we do not consider the objects with Plx < 2 mas according to our first astrometric criterion from Sect. 2.1 (black open squares in Fig. 18) and those that do not fulfil at least one of the other three astrometric criteria (overplotted black dots). These objects, which we count as less reliable in their Gaia astrometry, preferentially lie at the upper and lower edges of the distribution. Interestingly, in this CMD, the known binaries that were not yet excluded by our astrometric criteria (open hexagons without open squares or black dots) do not show such a clear trend towards the bright and red borders as observed in the MG versus BP − RP CMD (bottom panel of Fig. 12).
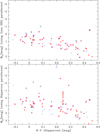 |
Fig. 18. Top: absolute V magnitudes computed from HIPPARCOS photometry but with Gaia DR2 parallaxes (MV = HPmag + 5log(Plx/100)) as a function of the HIPPARCOS B − V colour of 74 Ap stars with positive parallaxes in both catalogues. The symbols are the same as used in Figs. 12 and 15. Bottom: HIPPARCOS parallaxes HPlx were used to compute the absolute magnitudes (MV = HPmag + 5log(HPlx/100)). The labelled object (HD 81009) is not shown in the top panel because its Gaia DR2 parallax is negative. |
When we used the HIPPARCOS parallaxes HPlx instead of those of Gaia DR2 to compute MV, we found a much larger spread in MV over all B − V colours for the 75 objects in common (bottom panel of Fig. 18). The one missing star HD 81009 that is not shown in the top panel, which appeared problematic in Gaia DR2 not only because of its negative parallax, but also with respect to all other astrometric criteria, now falls in the central region of the distribution. In this case, the HIPPARCOS result is clearly more reliable. However, it seems obvious that the main reason for the large MV spread in the bottom panel of Fig. 18 lies in the larger errors of the HIPPARCOS parallaxes. In the objects that had deviations greater than 1 mag between the MV based on HIPPARCOS and Gaia DR2 parallaxes alone we found 14 stars of which only 5 did not pass our Gaia DR2 astrometric selection. Absolute magnitude deviations of more than 0.5 mag were found for 34 stars, including 13 for which we derived an astrometry flag af > 0.
5. Conclusions and outlook
We have analysed the Gaia DR2 and HIPPARCOS data of the recently extended sample of Ap stars with measured magnetic field moduli with respect to their astrometric and photometric reliability. In our catalogue of 237 stars we not only collected their most important Gaia DR2 and HIPPARCOS (if available) observaional data and some physical parameters (Teff, Lum) provided with Gaia DR2, but also assigned RUWE as the main astrometric quality parameter for Gaia DR2. Together with three other astrometric criteria (including a minimum parallax of 2 mas), we flagged our astrometrically most reliable stars in the catalogue. With other flags we provided the information on known close (with small angular separations) and new CPPM wide (with angular separations of up to 60 arcsec) binaries, open cluster members (identified by us), and variability. The significance of the variability amplitudes vaGs, vaBs, and vaRs in the G, BP, and RP bands of Gaia were newly estimated by us using Gaussian fits in small magnitude bins. This allowed us to better separate the long tails in the highly non-symmetric distributions from the bulk of photometrically constant stars.
We confirmed the recommended limit of RUWE < 1.4 for astrometrically well-behaved objects by our analysis of the best CPPM companions. More importantly, our astrometric selection criteria (including RUWE) allowed us to exclude almost all outliers in the Gaia DR2 CMD (where we determined absolute G magnitudes using inverted parallaxes) and HRD (where we replaced measured BP − RP colours by the derived Teff). As a large RUWE was expected for relatively close binaries, our astrometric and binary flags are correlated. From 26 known binaries in our sample, we excluded almost 60% using our astrometric selection criteria. The remaining 11 known binaries as well as some of the highly variable objects according to our variability analysis were found to be preferentially located at the bright and red borders of the distributions of 93 astrometrically clean Ap stars in the Gaia DR2 CMD and HRD. The use of luminosities Lum derived by Gaia DR2 (only for objects with Teff < 8000 K) instead of absolute G magnitudes did not provide new information because log Lum and MG of our Ap stars were found to be linearly related with residual differences of mostly below ±0.04 mag. We also compared the CMDs based on HIPPARCOSB, V photometry and parallaxes taken either from Gaia DR2 or HIPPARCOS. The absolute V magnitudes of the 75 stars appearing in both catalogues showed a much narrower distribution over the full B − V colour range when we used inverted Gaia DR2 instead of HIPPARCOS parallaxes.
The question is whether the HIPPARCOS data on all bright stars and binaries should be generally preferred because Gaia DR2 data on bright stars may be unreliable and because all stars are treated as single stars in Gaia DR2, whereas the HIPPARCOS astrometric solutions involved more than five parameters if needed (see parameters Sn and So in Table 1). In their study of very bright (V = 0−11 mag) magnetic early-B stars, Shultz et al. (2019) compared HIPPARCOS and Gaia DR2 data and found the HIPPARCOS data to be more reliable for stars with V < 6 mag and for known binaries with V ≲ 6.8 mag (see their Table 3). Figure 7 shows that the two obvious cases, where we can prefer HIPPARCOS results because the exceptionally large Gaia DR2 parallax errors probably result in the largest HIPPARCOS–Gaia DR2 differences, include the brightest of the old Ap stars at V ≈ 3.7 mag but also a moderately bright star with V ≈ 6.6 mag. Both were also excluded by our astrometric criteria. Of the brightest eight stars with V ≲ 6.2 mag, similar to the limit found by Shultz et al. (2019), seven are binaries and six do not fulfil our astrometric criteria either. However, one star (=HD 188041) at V ≈ 5.7 mag also has no signs of binarity and an astrometry flag af = 0, which indicates high quality in Gaia DR2. A general magnitude limit below which the Gaia DR2 parallaxes should be replaced by the HIPPARCOS parallaxes may not be justified. Instead, we recommend using our astrometric quality criteria, supplemented by the information on known binaries, to decide which data should be preferred.
In Paper II we plan to continue our analysis of the location of the Ap stars with reliable Gaia DR2 data in CMDs after taking extinction and reddening corrections into account. From the extinction AG and reddening E(BP − RP) values provided for part of the stars in Gaia DR2, we can create 3D maps in a similar way as done by Zari et al. (2018) in their study of young stars within 500 pc of the Sun. This will allow us to study the Ap stars in the Gaia DR2 CMD with respect to isochrones from the PAdova and TRieste Stellar Evolution Code (PARSEC; Bressan et al. 2012). Additional photometric data like those from Tycho-2 (Høg et al. 2000) and the Two Micron All Sky Survey (2MASS; Skrutskie et al. 2006), which are available for most Ap stars, will be compared with the corresponding PARSEC isochrones in different photometric systems. To study physical parameters such as mass, radius, log g, and age of our Ap stars in HRDs, we will determine extinction-corrected luminosities that replace available individual values and extend to hotter temperatures than provided in Gaia DR2.
Half of the old Ap stars and almost all of the new ones are still lacking detailed information on the existence and properties of close binary companions that would affect the magnitudes and colours of the stars in the Gaia DR2 CMDs. Even for apparently reliable astrometric measurements are magnitude and colour shifts expected depending on the magnitude and colour of the unresolved companion. Therefore, dedicated studies, such as radial velocity monitoring, are needed to uncover the binaries among all Ap stars. In Paper II we will also discuss the spectroscopic appearance of the detected outliers that are located outside the MS in the Gaia CMD and HRD. It is quite possible that these stars are members of unrecognized spectroscopic binary systems or have very peculiar spectra.
As we described in the introduction, the ultimate goal of our study is the exploitation of the unprecedented accuracy of the Gaia DR2 astrometric data to place our sample stars in the HRD and provide us with the best determined stellar parameters. As a next step, accurate Teff (alternative to the Teff provided in Gaia DR2) and log g for all targets will be obtained from available near-IR and optical spectra. The best known distribution of the strongly magnetic Ap stars in the HRD will allow us to conclude on their evolutionary status, that is, to prove whether the appearance of strong magnetic fields is connected to a particular phase of MS evolution. Furthermore, the study of the magnetic field strength as a function of the completed fraction of MS life will permit us to investigate whether the magnetic flux remains constant over the stellar life time on the MS. The exploitation of Gaia DR2 astrometric data will also provide the best basis for the study of possible relations between the magnetic field strength and other stellar parameters, such as stellar mass and Teff.
Acknowledgments
This work presents results from the European Space Agency (ESA) space mission Gaia. Gaia data are being processed by the Gaia Data Processing and Analysis Consortium (DPAC). Funding for the DPAC is provided by national institutions, in particular the institutions participating in the Gaia MultiLateral Agreement (MLA). The Gaia mission website is https://www.cosmos.esa.int/gaia. The Gaia archive website is https://archives.esac.esa.int/gaia. We have also extensively used SIMBAD and VizieR at the CDS/Strasbourg and would like to thank the CDS staff for their valuable work. We thank the anonymous referee for the constructive report that helped us improve the paper.
References
- Andrae, R., Fouesneau, M., Creevey, O., et al. 2018, A&A, 616, A8 [NASA ADS] [CrossRef] [EDP Sciences] [Google Scholar]
- Babcock, H. W. 1958, ApJS, 3, 141 [NASA ADS] [CrossRef] [Google Scholar]
- Babcock, H. W. 1960, ApJ, 132, 521 [NASA ADS] [CrossRef] [Google Scholar]
- Bailey, J. D., Landstreet, J. D., Bagnulo, S., et al. 2011, A&A, 535, A25 [NASA ADS] [CrossRef] [EDP Sciences] [Google Scholar]
- Bossini, D., Vallenari, A., Bragaglia, A., et al. 2019, A&A, 623, A108 [NASA ADS] [CrossRef] [EDP Sciences] [Google Scholar]
- Bressan, A., Marigo, P., Girardi, L., et al. 2012, MNRAS, 427, 127 [NASA ADS] [CrossRef] [Google Scholar]
- Briquet, M., Hubrig, S., De Cat, P., et al. 2007, A&A, 466, 269 [NASA ADS] [CrossRef] [EDP Sciences] [Google Scholar]
- Cantat-Gaudin, T., Jordi, C., Vallenari, A., et al. 2018, A&A, 618, A93 [NASA ADS] [CrossRef] [EDP Sciences] [Google Scholar]
- Chojnowski, S. D., Hubrig, S., Hasselquist, S., et al. 2019, ApJ, 873, L5 [NASA ADS] [CrossRef] [Google Scholar]
- Deason, A. J., Belokurov, V., Erkal, D., Koposov, S. E., & Mackey, D. 2017, MNRAS, 467, 2636 [NASA ADS] [CrossRef] [Google Scholar]
- ESA 1997, in The HIPPARCOS and TYCHO catalogues. Astrometric and Photometric Star Catalogues Derived from the ESA HIPPARCOS Space Astrometry Mission, ESA Spec. Publ., 1200 [Google Scholar]
- Eyer, L., Guy, L., Distefano, E., et al. 2018, Gaia DR2 documentation Chapter 7: Variability, Tech. rep. [Google Scholar]
- Gaia Collaboration (Babusiaux, C., et al.) 2018a, A&A, 616, A10 [NASA ADS] [CrossRef] [EDP Sciences] [Google Scholar]
- Gaia Collaboration (Brown, A. G. A., et al.) 2018b, A&A, 616, A1 [NASA ADS] [CrossRef] [EDP Sciences] [Google Scholar]
- Gaia Collaboration (Eyer, L., et al.) 2019, A&A, 623, A110 [NASA ADS] [CrossRef] [EDP Sciences] [Google Scholar]
- Høg, E., Fabricius, C., Makarov, V. V., et al. 2000, A&A, 355, L27 [Google Scholar]
- Holl, B., Audard, M., Nienartowicz, K., et al. 2018, A&A, 618, A30 [NASA ADS] [CrossRef] [EDP Sciences] [Google Scholar]
- Hubrig, S., North, P., & Mathys, G. 2000, ApJ, 539, 352 [NASA ADS] [CrossRef] [Google Scholar]
- Hubrig, S., North, P., & Schöller, M. 2007, Astron. Nachr., 328, 475 [NASA ADS] [CrossRef] [Google Scholar]
- Kharchenko, N. V., Piskunov, A. E., Schilbach, E., Röser, S., & Scholz, R.-D. 2013, A&A, 558, A53 [NASA ADS] [CrossRef] [EDP Sciences] [Google Scholar]
- Lindegren, L. 2018, Gaia Technical Note GAIA-C3-TN-LU-LL-124-01 [Google Scholar]
- Lindegren, L., Hernández, J., Bombrun, A., et al. 2018, A&A, 616, A2 [NASA ADS] [CrossRef] [EDP Sciences] [Google Scholar]
- Majewski, S. R., Schiavon, R. P., Frinchaboy, P. M., et al. 2017, AJ, 154, 94 [NASA ADS] [CrossRef] [Google Scholar]
- Mathys, G. 2017, A&A, 601, A14 [NASA ADS] [CrossRef] [EDP Sciences] [Google Scholar]
- Moss, D. 2001, ASP Conf. Ser., 248, 305 [Google Scholar]
- Preston, G. W. 1974, ARA&A, 12, 257 [NASA ADS] [CrossRef] [MathSciNet] [Google Scholar]
- Röser, S., Schilbach, E., & Goldman, B. 2016, A&A, 595, A22 [NASA ADS] [CrossRef] [EDP Sciences] [Google Scholar]
- Shultz, M. E., Wade, G. A., Rivinius, T., et al. 2019, MNRAS, 485, 1508 [NASA ADS] [CrossRef] [Google Scholar]
- Skrutskie, M. F., Cutri, R. M., Stiening, R., et al. 2006, AJ, 131, 1163 [NASA ADS] [CrossRef] [Google Scholar]
- van Leeuwen, F. 2007, A&A, 474, 653 [NASA ADS] [CrossRef] [EDP Sciences] [Google Scholar]
- Vioque, M., Oudmaijer, R. D., Baines, D., Mendigutía, I., & Pérez-Martínez, R. 2018, A&A, 620, A128 [NASA ADS] [CrossRef] [EDP Sciences] [Google Scholar]
- Wade, G. A., Mathys, G., & North, P. 1999, A&A, 347, 164 [NASA ADS] [Google Scholar]
- Weisstein, E. W. 1998, CRC Concise Encyclopedia of Mathematics [Google Scholar]
- Zari, E., Hashemi, H., Brown, A. G. A., Jardine, K., & de Zeeuw, P. T. 2018, A&A, 620, A172 [NASA ADS] [CrossRef] [EDP Sciences] [Google Scholar]
- Zasowski, G., Johnson, J. A., Frinchaboy, P. M., et al. 2013, AJ, 146, 81 [NASA ADS] [CrossRef] [Google Scholar]
All Tables
Description of the Gaia DR2-based catalogue of 237 strongly magnetic Ap stars with resolved magnetically split lines.
All Figures
|
Fig. 1. Distribution on the sky (in Galactic coordinates) of the old (red filled symbols, Mathys 2017), and new (blue open symbols, Chojnowski et al. 2019) AP stars. |
| In the text | |
|
Fig. 2. Distribution of Gaia DR2 G magnitudes of old (Mathys 2017) and new (Chojnowski et al. 2019) Ap stars. |
| In the text | |
|
Fig. 3. Gaia DR2 parallaxes and RUWE of the astrometric solution for old (red filled symbols) and new (blue open symbols) Ap stars. The solid line marks the allowed maximum (RUWE = 1.4) for well-behaved astrometric solutions (Lindegren 2018). The dotted line indicates zero parallaxes, and the dashed line marks the lower parallax limit of 2 mas that we applied in our selection of the astrometrically most reliable stars (Sect. 2.1). Stars with negative or missing parallaxes, or for which only a lower limit of RUWE could be estimated, are labelled (see text). |
| In the text | |
|
Fig. 4. Gaia DR2 ratio of parallax to parallax error as a function of RUWE for old and new Ap stars. The symbols and dotted and solid lines are the same as in Fig. 3. Objects above the dashed line have parallaxes better than 10%. |
| In the text | |
|
Fig. 5. Gaia DR2 number of visibility_periods_used as a function of RUWE. Old and new Ap stars without information on their binarity are plotted as small filled and open symbols, respectively. Stars described by Mathys (2017) as single or close binary stars are plotted with pluses and asterisks, respectively. Only one of the apparently single stars (HD 51684, labelled) has RUWE > 1.4. Two old Ap stars with negative parallax (HD 81009) or with only an estimated lower limit of RUWE (HD 137909) are also labelled, as are the two stars with the lowest number of visibility_periods_used (HD 9996 and 2MASS J18261274−0646548). For our selection of the best-measured stars, we used visibility_periods_used > 9, which is indicated by the dashed line. |
| In the text | |
|
Fig. 6. Parallax ratio (bottom) and proper motion differences (upper two panels) as a function of the maximum RUWE in a CPPM pair. Only stars with a parallax precision better than 20% were considered in our search for CPPM stars around 84 and 154 old and new Ap stars (see text). Open and filled symbols show the candidates after our initial and final search criteria, respectively. The dashed lines mark our final CPPM criteria, and the vertical solid line shows the recommended limit of the RUWE for astrometrically well-behaved objects. |
| In the text | |
|
Fig. 7. HIPPARCOS–Gaia DR2 parallax differences of old (red filled lozenges) and new (blue open lozenges) Ap stars as a function of the HIPPARCOS V magnitude (HPmag in Table 1). Error bars represent the sum of the errors from both catalogues. Two objects, for which the Gaia DR2 errors were larger than the HIPPARCOS ones, are labelled. Overplotted black dots mark stars that do not fulfil the last three astrometric criteria defined in Sect. 2.1. Magenta open hexagons and green open squares mark stars that were found to be binaries by Mathys (2017) and HIPPARCOS, respectively. |
| In the text | |
|
Fig. 8. Comparison of the astrometric quality criteria F2 (goodness of fit; see Table 1) from HIPPARCOS (van Leeuwen 2007) and RUWE from Gaia DR2. Values exceeding F2 > 3 (dashed line) and RUWE > 1.4 (solid line) indicate a poor astrometric fit of the HIPPARCOS and Gaia DR2 data, respectively. Magenta open hexagons and green open squares mark known binaries. |
| In the text | |
|
Fig. 9. G-band variability amplitude (va_G) of all Gaia DR2 sources with G < 13 mag, excluding those with known variability flags and with RUWE > 1.4, as a function of G magnitude. All objects at G < 8.5 mag but only every 50th object at G > 8.5 mag are plotted as black dots for clarity. Overplotted cyan symbols and error bars show the simple mean values and standard deviations in 0.1 mag wide intervals, whereas red symbols and their error bars show the corresponding results from Gaussian fits. |
| In the text | |
|
Fig. 10. Top: G-band variability amplitudes (va_G) as a function of G magnitude for all objects (3.5 < G < 13 mag) that are flagged as variables in Gaia DR2 (green dots). Black filled squares and error bars show the Gaussian centres and standard deviations computed from the Gaussian FWHM for objects without a variability flag and with RUWE < 1.4, respectively, in each 0.1 mag wide interval. An 18th-order polynomial fit of the Gaussian centres resulted in the black solid line. The black dashed line represents three times of the standard deviations (also obtained from an 18th-order polynomial fit) added. Overplotted are the data for the old (filled symbols) and new (open symbols) Ap stars. Middle: va_B using 12th-order polynomials. Bottom: va_R with 15th-order polynomials. |
| In the text | |
|
Fig. 11. Gaia DR2 CMD for all bright stars (5 < G < 12 mag) with parallaxes > 2 mas (yellow dots). Overplotted as green dots are stars with a parallax precision better than 10% (RPlx > 10) and well-behaved astrometric solutions, i.e. RUWE < 1.4 and an increased number of visibility_periods_used (Np > 9). Filled and open lozenges show all old and new Ap stars with available Gaia measurements (including those with low astrometric quality), respectively. |
| In the text | |
|
Fig. 12. Top: zoom into the high-quality Gaia DR2 CMD of bright stars (5 < G < 12 mag) with parallaxes > 2 mas, RPlx > 10, RUWE < 1.4, and Np > 9 as green dots. As in Fig. 11, all our old and new Ap stars are shown as filled and open lozenges, respectively. In addition, we indicate Ap stars with parallaxes < 2 mas with open squares, and those with problematic astrometry (RPlx < 10 or RUWE > 1.4 or Np < 10) with small filled circles. Binaries (according to Mathys 2017 (bf = 1) or HIPPARCOS (Nc = 2)) are overplotted as large open hexagons. Obvious outliers are labelled with their names (see text). Bottom: only 47 (of 82) old and 46 (of 153) new Ap stars remain after our astrometric quality criteria are applied. One remaining CMD outlier that falls below the blue MS edge is labelled. |
| In the text | |
|
Fig. 13. Top: CMD with all our old and new Ap stars as filled and open lozenges, respectively, with the same symbols overplotted for the more distant, astrometrically less reliable, and known binary objects as in Fig. 12. For clarity, the outliers are not labelled and the high-quality stars in the background are omitted. The overplotted vertical bars of different sizes indicate objects with highly significant G-band variability amplitudes, and horizontal bars show the objects with the most significant variability in the BP- or RP-band (see text). Bottom: same after astrometric selection. |
| In the text | |
|
Fig. 14. Same as Fig. 11, where the BP − RP colour has been replaced by the Teff that is also provided in Gaia DR2 (Andrae et al. 2018). |
| In the text | |
|
Fig. 15. Same as Fig. 12, with all Ap stars in the top and the remaining Ap stars after our astrometric selection in the bottom panel, where the BP − RP colour has been replaced by the Teff that is also provided in Gaia DR2 (Andrae et al. 2018). Except for HD 137909 (see text), the marked objects are the same as labelled in Fig. 12 as outliers. |
| In the text | |
|
Fig. 16. Gaia DR2 effective temperatures and BP − RP colours of old (red filled lozenges) and new (open blue lozenges) Ap stars. The overplotted black open squares and dots mark the most distant and astrometrically problematic objects (Sect. 2.1), respectively. In the colour range 0.2 < BP − RP < 0.6 (between the dashed lines), new Ap stars show a larger scatter and systematically hotter Teff. The slope of the approximately linear relationship becomes flatter at BP − RP > 0.6. |
| In the text | |
|
Fig. 17. Top: Gaia DR2 absolute magnitudes MG of all Ap stars with Teff < 8000 K as a function of the logarithm of their luminosities Lum. The black line represents a linear fit. Bottom: residual differences beween the MG and their fitted values MG(fit). Objects with absolute differences larger than 0.04 mag (dashed lines) are marked by their names. |
| In the text | |
|
Fig. 18. Top: absolute V magnitudes computed from HIPPARCOS photometry but with Gaia DR2 parallaxes (MV = HPmag + 5log(Plx/100)) as a function of the HIPPARCOS B − V colour of 74 Ap stars with positive parallaxes in both catalogues. The symbols are the same as used in Figs. 12 and 15. Bottom: HIPPARCOS parallaxes HPlx were used to compute the absolute magnitudes (MV = HPmag + 5log(HPlx/100)). The labelled object (HD 81009) is not shown in the top panel because its Gaia DR2 parallax is negative. |
| In the text | |
Current usage metrics show cumulative count of Article Views (full-text article views including HTML views, PDF and ePub downloads, according to the available data) and Abstracts Views on Vision4Press platform.
Data correspond to usage on the plateform after 2015. The current usage metrics is available 48-96 hours after online publication and is updated daily on week days.
Initial download of the metrics may take a while.