Fig. 13.
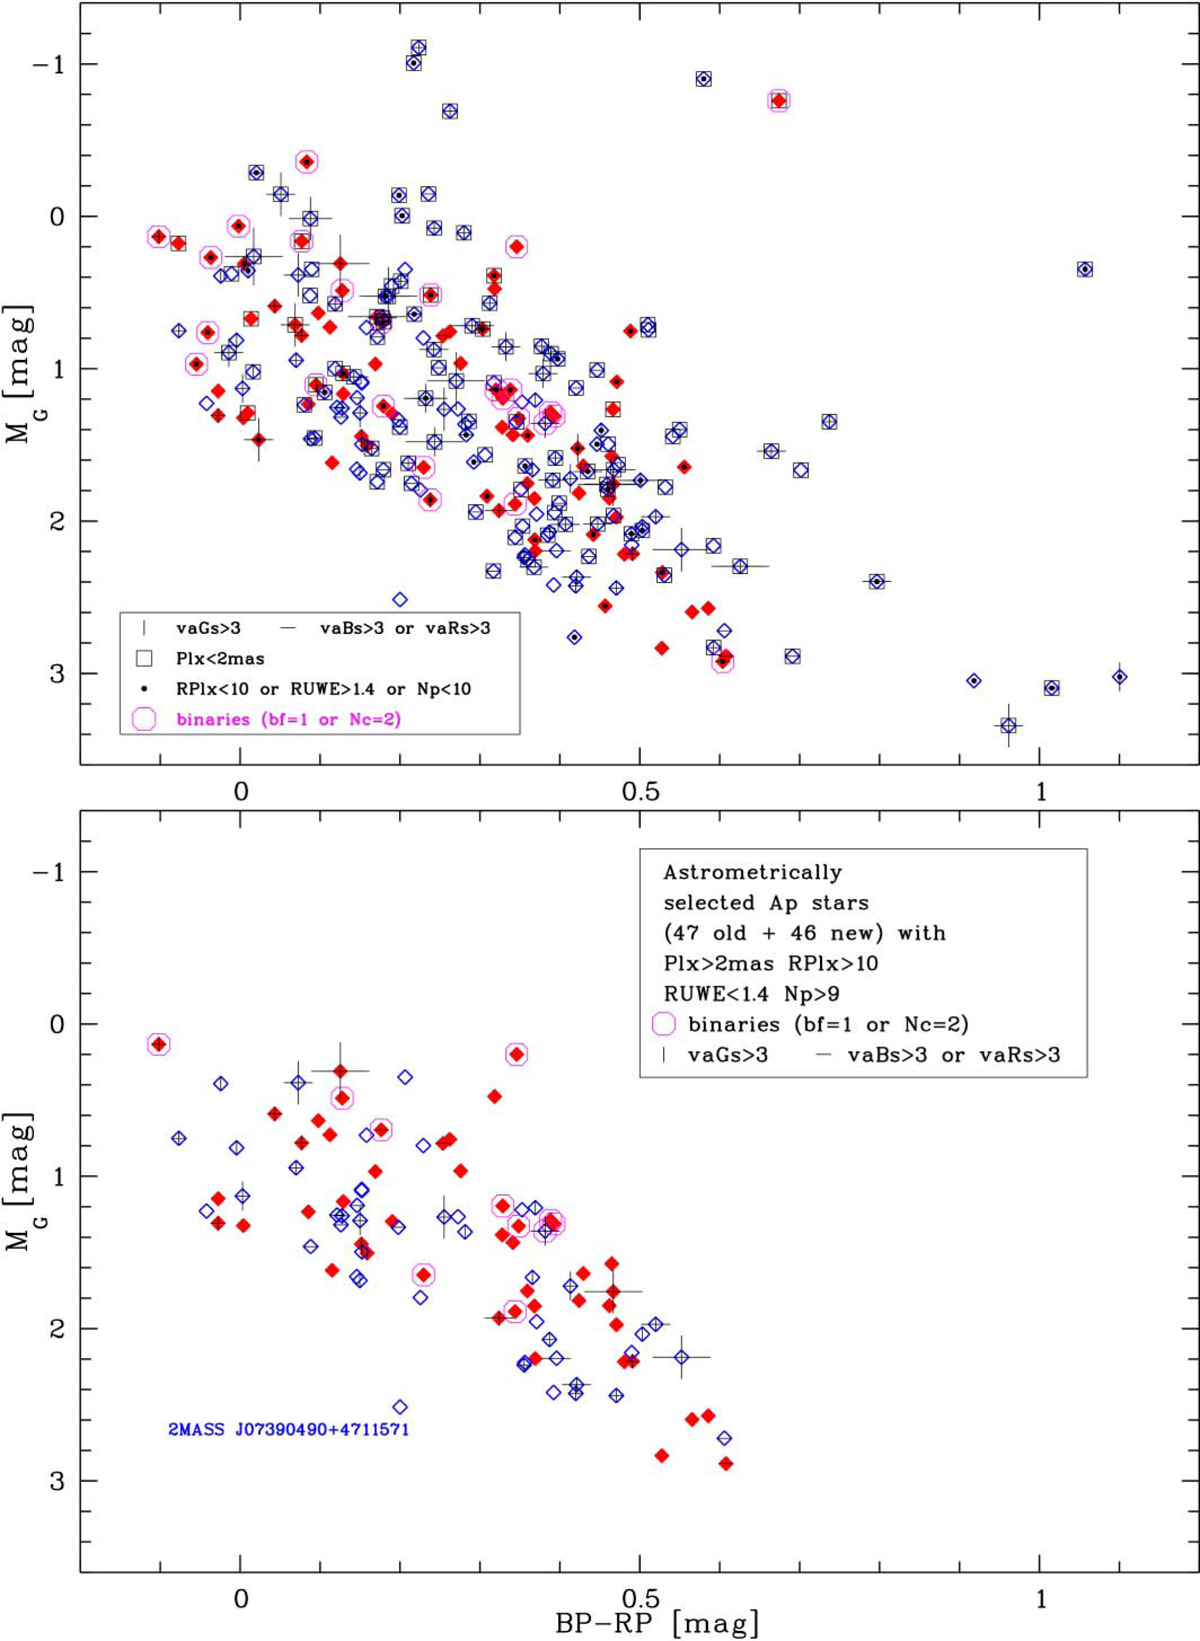
Top: CMD with all our old and new Ap stars as filled and open lozenges, respectively, with the same symbols overplotted for the more distant, astrometrically less reliable, and known binary objects as in Fig. 12. For clarity, the outliers are not labelled and the high-quality stars in the background are omitted. The overplotted vertical bars of different sizes indicate objects with highly significant G-band variability amplitudes, and horizontal bars show the objects with the most significant variability in the BP- or RP-band (see text). Bottom: same after astrometric selection.
Current usage metrics show cumulative count of Article Views (full-text article views including HTML views, PDF and ePub downloads, according to the available data) and Abstracts Views on Vision4Press platform.
Data correspond to usage on the plateform after 2015. The current usage metrics is available 48-96 hours after online publication and is updated daily on week days.
Initial download of the metrics may take a while.